This data isn’t new, and it’s not enjoyed by anyone I’ve seen write about it, including plant-based or plant-free eating advocates.
It paints an unseemly picture of the Standard American Diet (SAD) or a diet gone wrong.
According to ERS’s loss-adjusted food availability data, total daily calories per person decreased by 2 percent between 2000 and 2010 from 2,545 to 2,481 calories. The share of calories from animal- and plant-based foods was the same in both years at 30 percent and 70 percent, respectively. In both years, grains were the primary contributor to daily calories per capita (596 in 2000 and 581 in 2010). Added plant-based fats and oils—such as salad and cooking oil, margarine, and shortening—ranked second (480 in 2000 and 518 in 2010), followed by meat, poultry, and fish (438 in 2000 and 416 in 2010).USDA ERS – A Look at Calorie Sources in the American Diet
The accuracy of food availability data is also challenging, even if it’s loss adjusted (meat tends to have lower food loss % than non-meat foods). However/and, the data is consistent with this year’s study using the NHANES data set, which shows that plant-sources are dominant, unfortunately, unhealthy ones are dominant, too:


The data
- The biggest caloric contributor to the American Diet is now grains (USDA & NHANES).
- The biggest contributor of grains is now refined grains (NHANES)
- Americans have not become more plant-based, nor have more Americans become vegan or vegetarian (USDA, Gallup)
- Americans’ protein sources have not switched from animal to plant-based (future post) either (NHANES)
- The above status quo does not bode well for our planet, as it results in more health care use (10% of carbon emissions in the US) and more pharmaceuticals (more carbon emissions than the auto industry)
I’m including a short timeline and my experience of what happens/what has happened when people/our country have substituted fat in their diet for carbohydrates.
They did as they were told, and these have been the results. A generic “eat more plants” or “eat more carbs” does not serve us well. A more specific “eat better plants, and eat better carbs” has had some results, but not very impressive ones, in the last 10 years.
Questions – Healthy People, Healthy Planet
- How would future dietary advice be modeled based on this experience?
- How would that advice incorporate personal peferences and values (which has not been done previously, as noted in the recent NutriRECS guidelines)?
- How would that advice support people with metabolic disease (current USDA guidelines are only intended for “healthy” people)?
- Can we reconcile that advice with planetary health at the individual human level or at the population level? (I have personally reconciled my own carbon footprint, which you can see here)
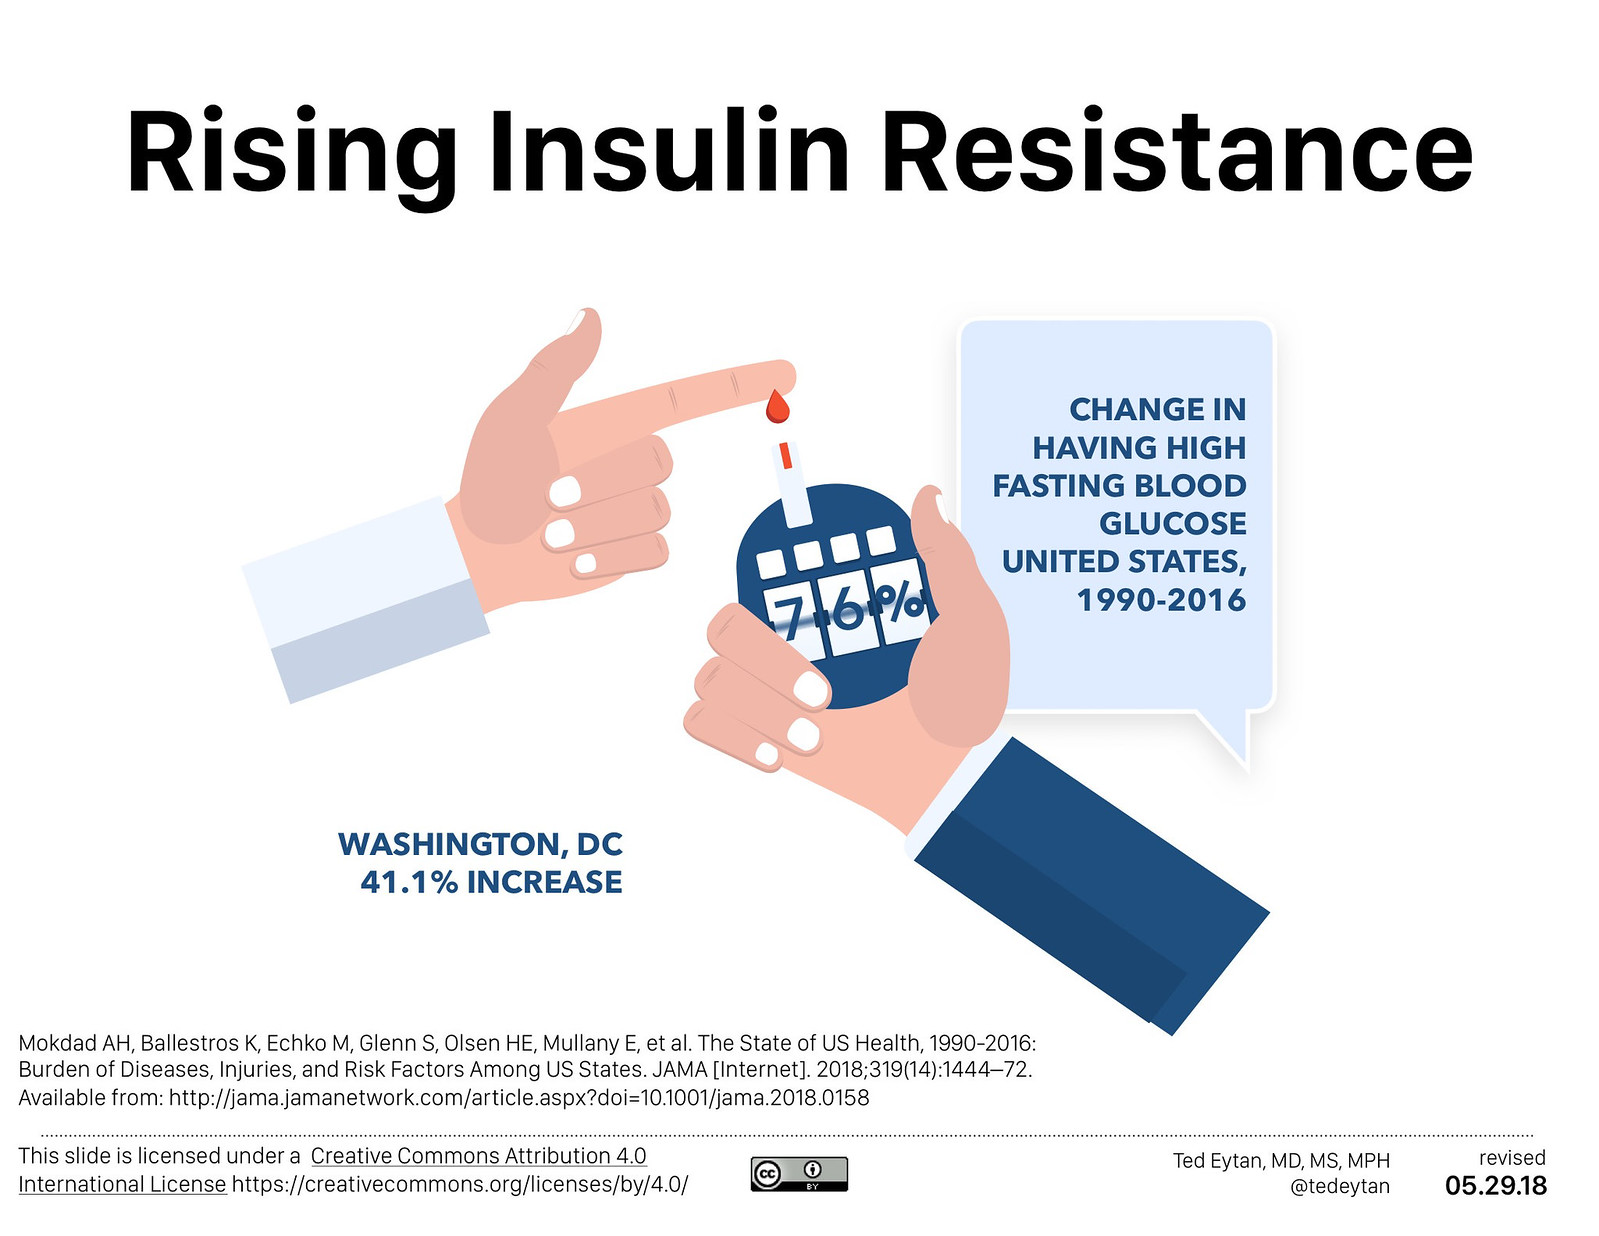
One correction below with newer data, Insulin is now the 7th most expensive liquid on the planet. It’s still right behind Chanel No. 5.
A recap of how we got here
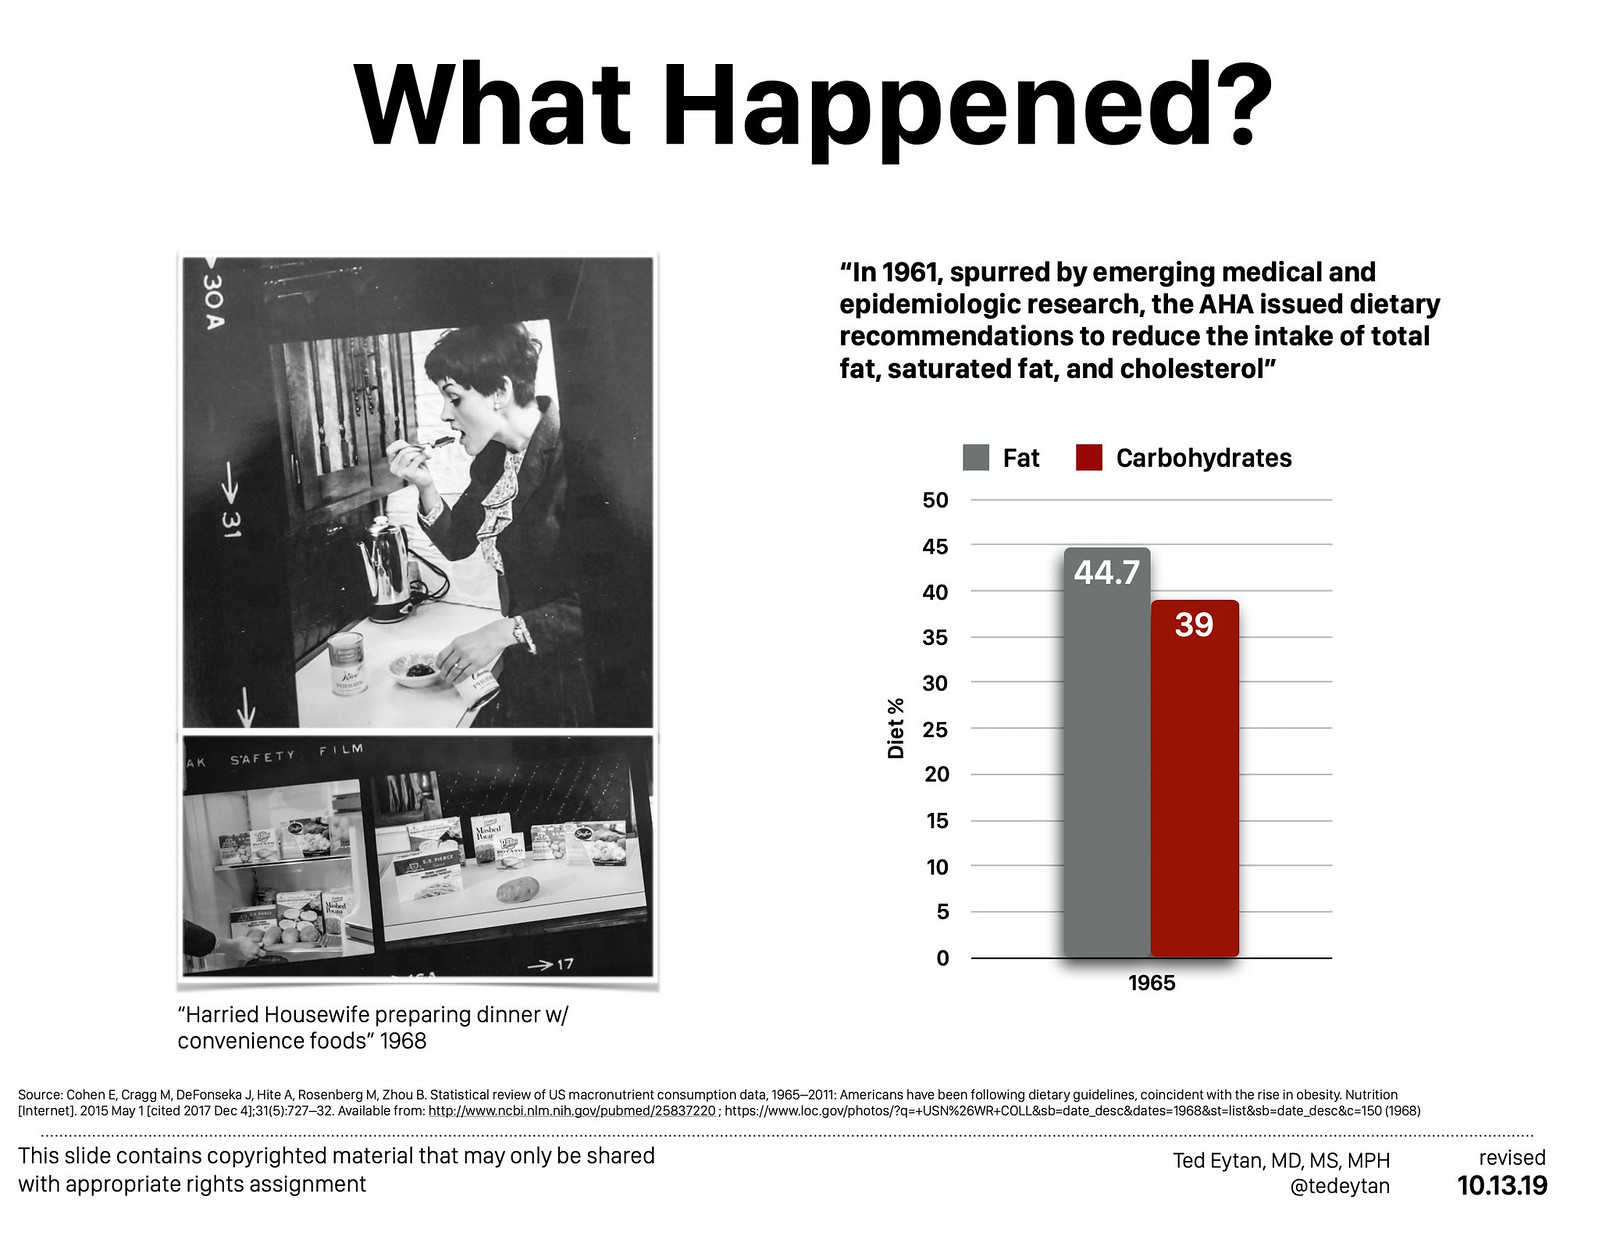
In 1961, spurred by emerging medical and epidemiologic research, the AHA issued dietary recommendations to reduce the intake of total fat, saturated fat, and cholesterol.Cohen E, Cragg M, DeFonseka J, Hite A, Rosenberg M, Zhou B. Statistical review of US macronutrient consumption data, 1965–2011: Americans have been following dietary guidelines, coincident with the rise in obesity. Nutrition [Internet]. 2015 May 1 [cited 2017 Dec 4];31(5):727–32. Available from: http://www.ncbi.nlm.nih.gov/pubmed/25837220

…the shift in the share of fat and carbohydrate is primarily due to an almost 65 g, or about a 260 kcal, daily increase in Americans’ intake of carbohydrate from 1965 to 2011.Cohen E, Cragg M, DeFonseka J, Hite A, Rosenberg M, Zhou B. Statistical review of US macronutrient consumption data, 1965–2011: Americans have been following dietary guidelines, coincident with the rise in obesity. Nutrition [Internet]. 2015 May 1 [cited 2017 Dec 4];31(5):727–32. Available from: http://www.ncbi.nlm.nih.gov/pubmed/25837220

There is a strong relationship between the increase in carbohydrate share of total intake and obesity. This is reflected by the high correlation at the individual level between caloric share from carbohydrate and adult BMI: 85.3% for men and 91.2% for women.Cohen E, Cragg M, DeFonseka J, Hite A, Rosenberg M, Zhou B. Statistical review of US macronutrient consumption data, 1965–2011: Americans have been following dietary guidelines, coincident with the rise in obesity. Nutrition [Internet]. 2015 May 1 [cited 2017 Dec 4];31(5):727–32. Available from: http://www.ncbi.nlm.nih.gov/pubmed/25837220

After 2000, shifts in scientific evidence and dietary guidelines promoted health benefits of healthy fats and plant sources of protein and the harms of low-quality carbohydrates.Shan Z, Rehm CD, Rogers G, Ruan M, Wang DD, Hu FB, et al. Trends in Dietary Carbohydrate, Protein, and Fat Intake and Diet Quality Among US Adults, 1999-2016. JAMA [Internet]. 2019 Sep 24 [cited 2019 Sep 30];322(12):1178. Available from: https://jamanetwork.com/journals/jama/fullarticle/2751719
41 years later


My Conflicts of Interest
You can access these on my disclosures page. Short version, I have none.
References
- Shan Z, Rehm CD, Rogers G, Ruan M, Wang DD, Hu FB, et al. Trends in Dietary Carbohydrate, Protein, and Fat Intake and Diet Quality Among US Adults, 1999-2016. JAMA [Internet]. 2019 Sep 24 [cited 2019 Sep 30];322(12):1178. Available from: https://jamanetwork.com/journals/jama/fullarticle/2751719 (See this post for conflict of interest noted in this piece, they are significant)
- Cohen E, Cragg M, DeFonseka J, Hite A, Rosenberg M, Zhou B. Statistical review of US macronutrient consumption data, 1965–2011: Americans have been following dietary guidelines, coincident with the rise in obesity. Nutrition [Internet]. 2015 May 1 [cited 2017 Dec 4];31(5):727–32. Available from: http://www.ncbi.nlm.nih.gov/pubmed/25837220
- https://www.ers.usda.gov/amber-waves/2016/december/a-look-at-calorie-sources-in-the-american-diet/
- https://www.flickr.com/photos/29069717@N02/10821800065