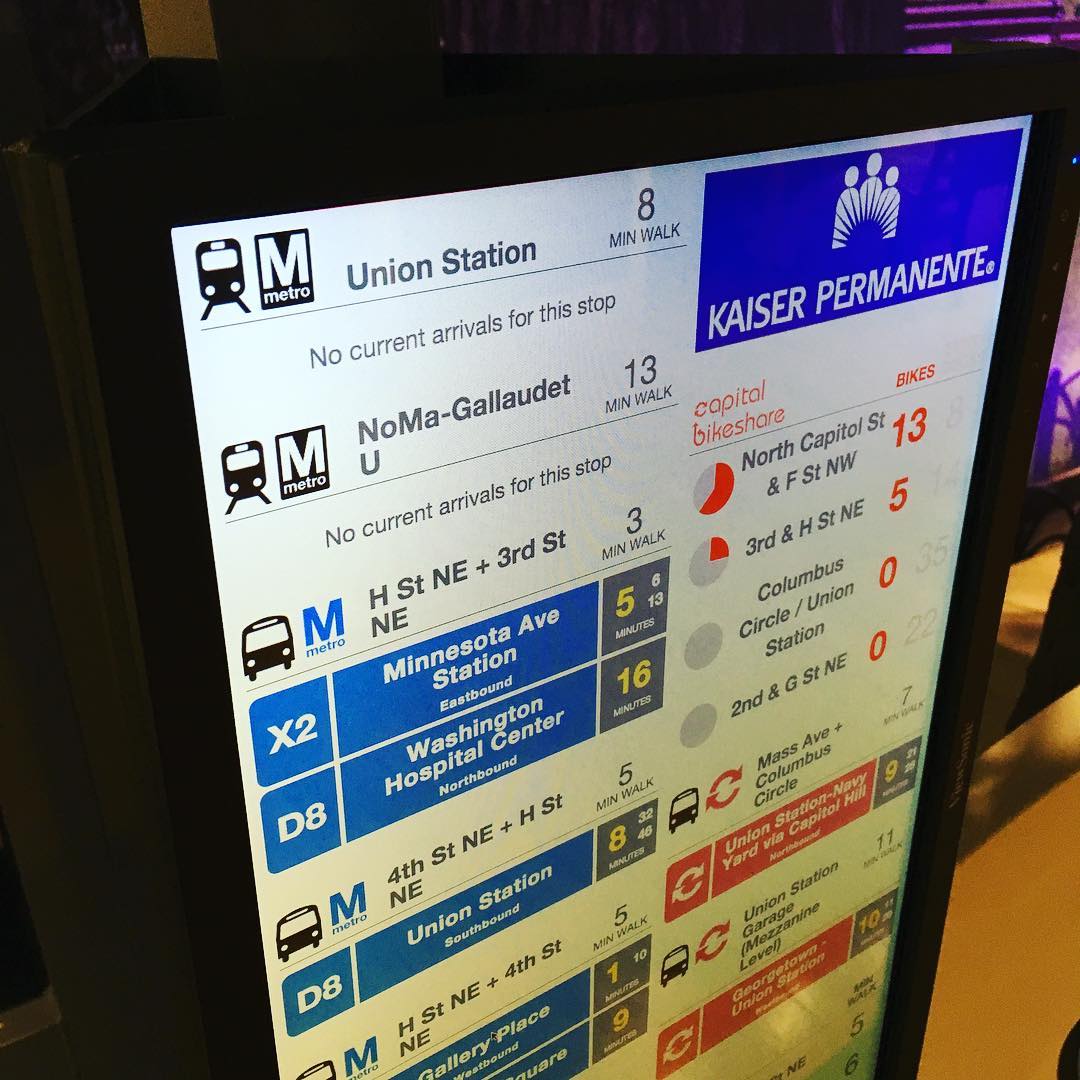
The Kaiser Permanente Center for Total Health (@KPTotalHealth) has a new population sensor, manufactured by Placemeter (@Placemeter), that monitors pedestrians on the Metropolitan Branch Trail outside of our social innovation center.
The sensor was installed about 3 weeks before the day the Washington, DC Metro was emergently shut down, on March 16.
I thought I’d take advantage of that unique event to see what happened to the movement of people on the Metropolitan Branch Trail.
What is Placemeter and how does it work?
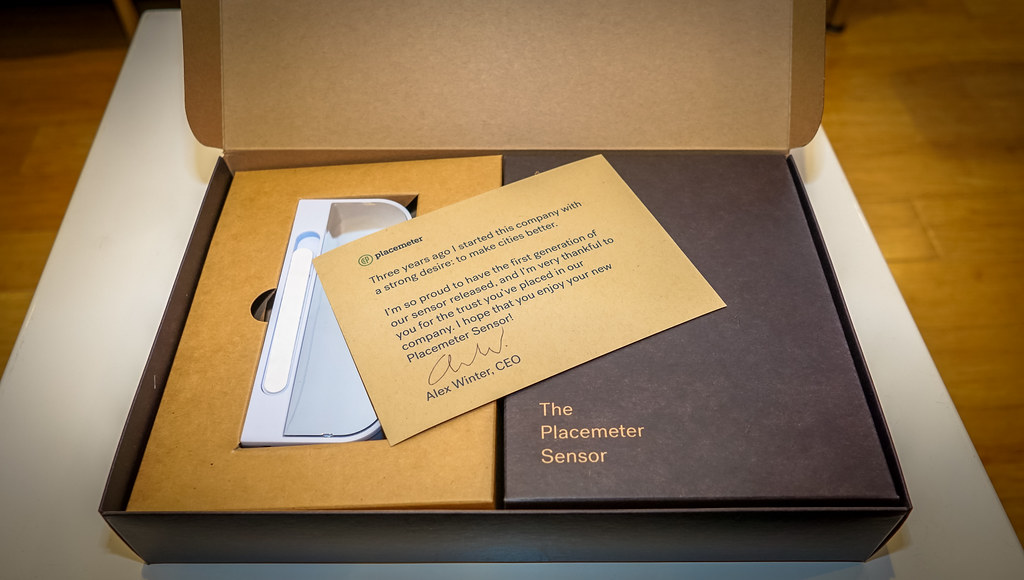
The Placemeter sensor is novel in that it uses computed video, rather than infrared signals, to assess the movement of people, with directionality.
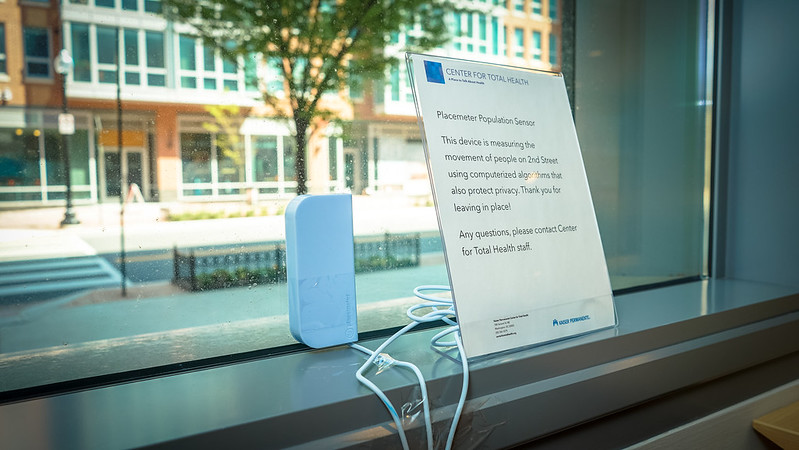
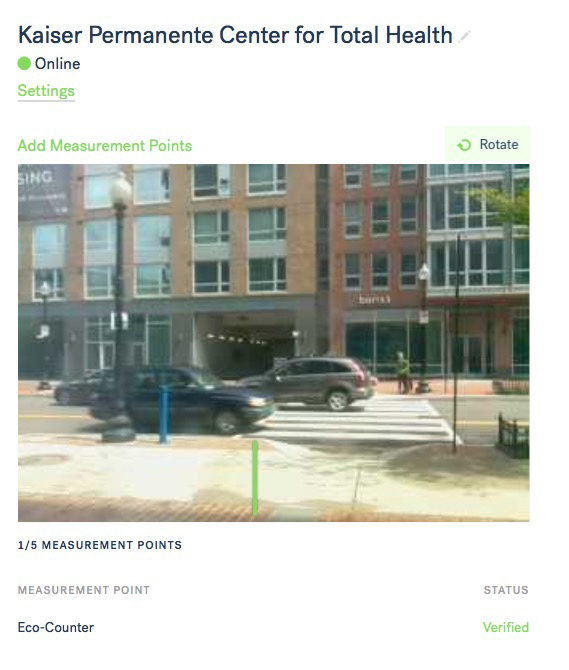
That counter is part of the Trail Modeling and Assessment program (see: What Exactly IS the Trail Modeling & Assessment Platform, and Why Do We Care? | Kaiser Permanente Center for Total Health).

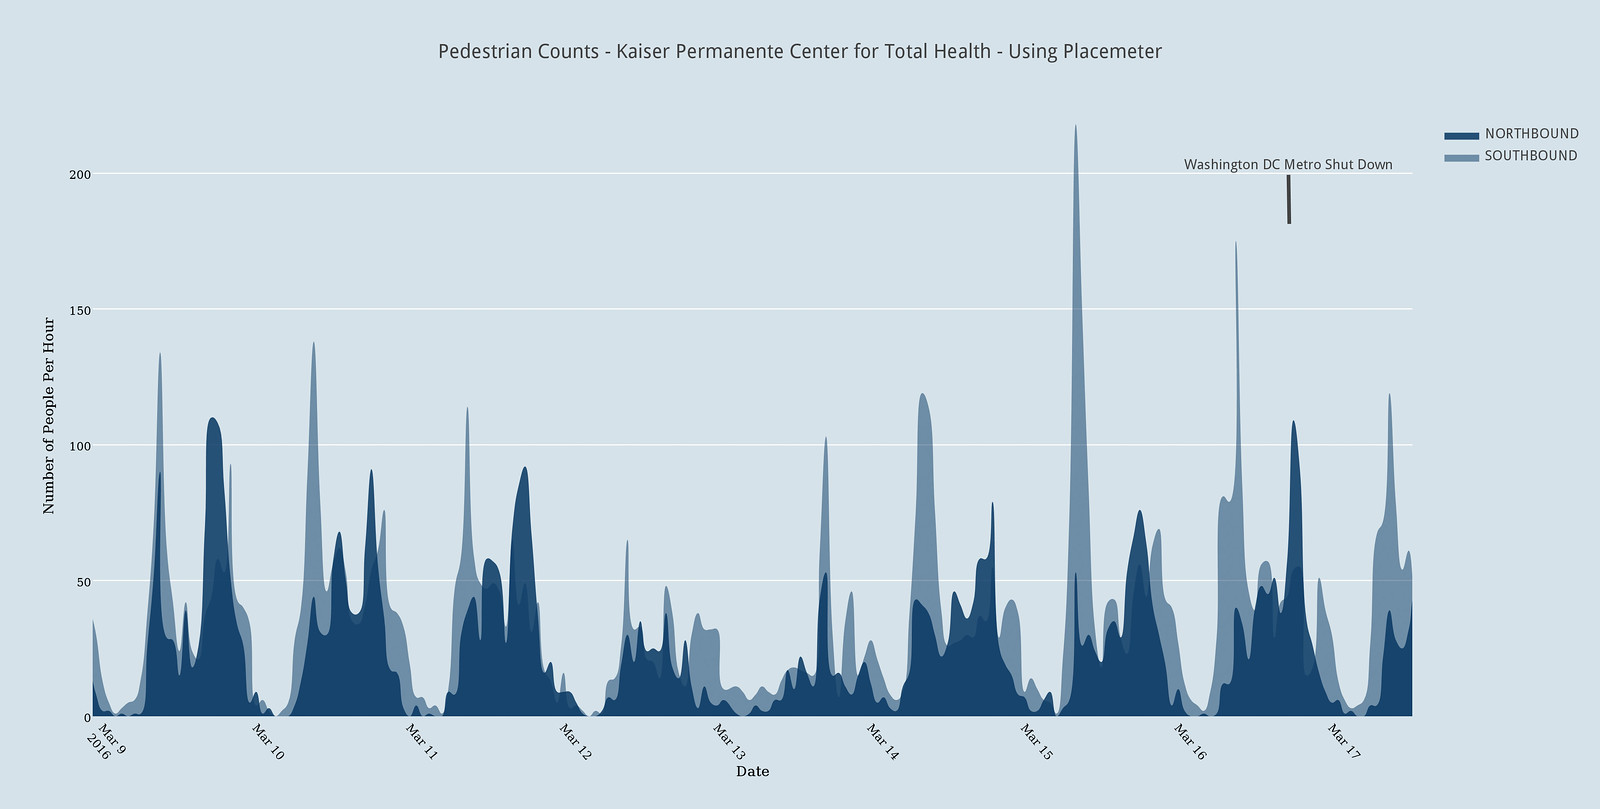
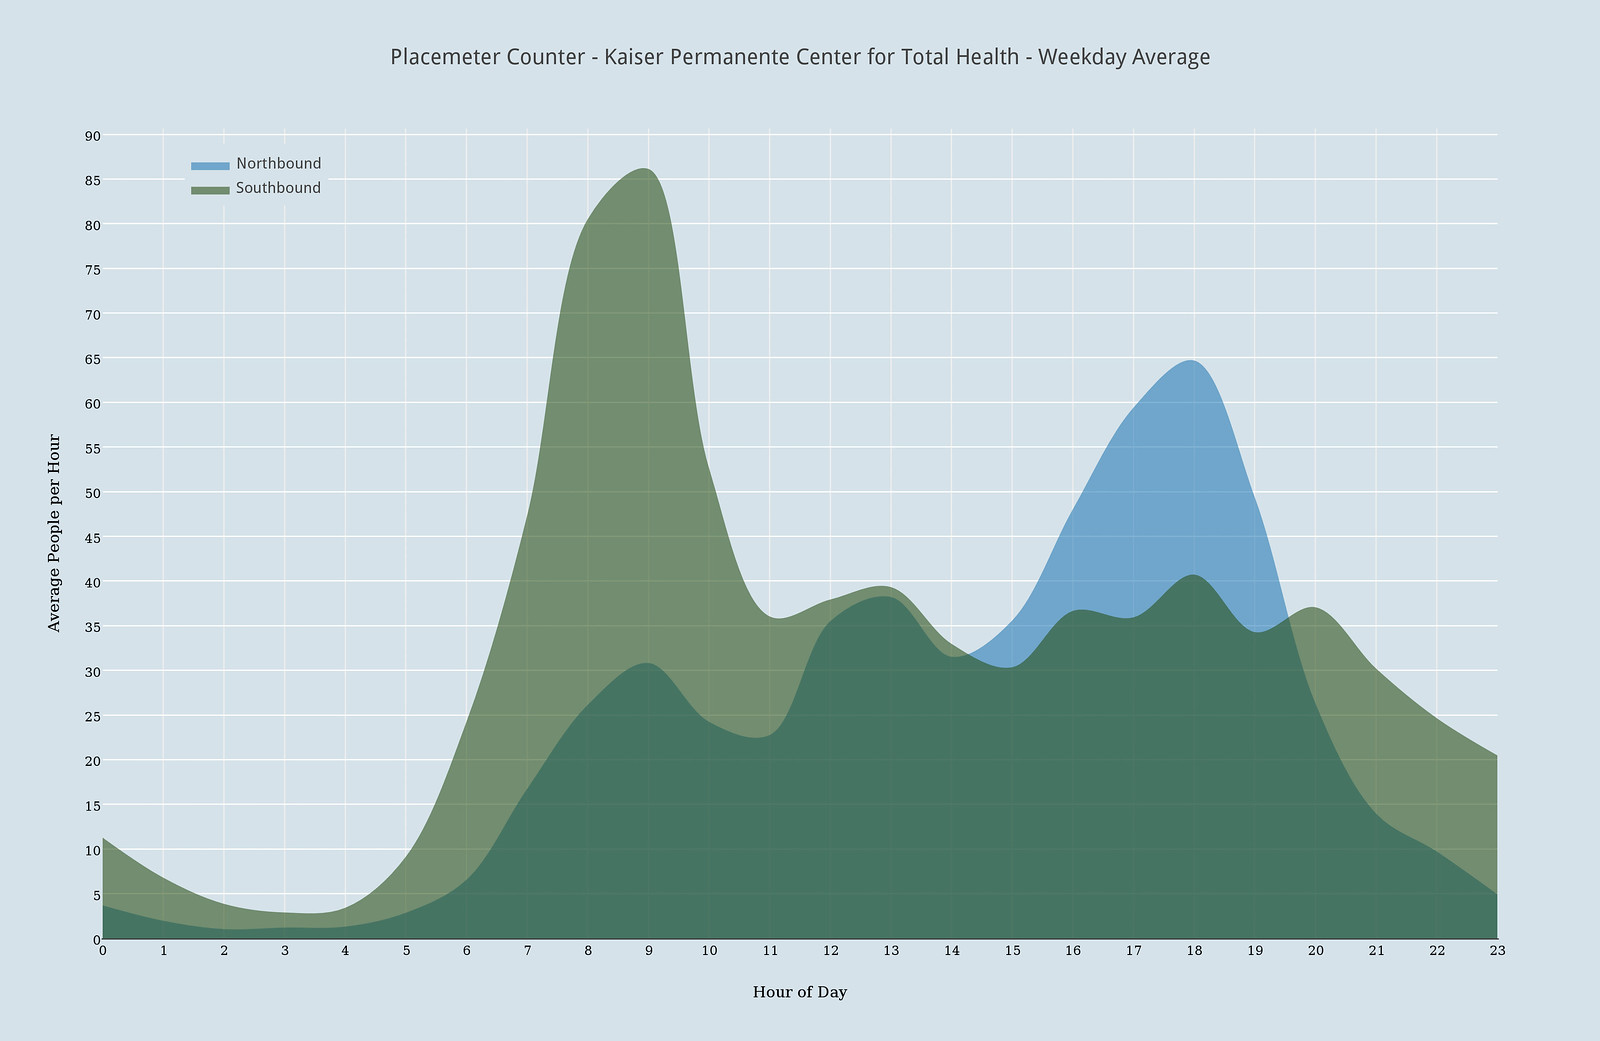
Our analysis of the data confirms that the Metropolitan Branch Trail we are sensing, which is 5 blocks north of the U.S. Capitol, exhibits a commuting pattern.
In the morning, people head south toward the capitol. In the evening, the reverse happens. Note that there’s a lower peak in the afternoon, which is thought to reflect the fact that people tend to leave work at various times.
Note that there’s also a peak during lunch time. This is interesting to us as well, because this part of the trail in the last 6 months has been acquiring more services and places to go as it becomes a complete, healthier street.
What did Placemeter tell us about March 16, 2016, when the Metro was shut down?
I reviewed Tracy’s excellent post on the Greater Greater Washington blog, and spoke with DC’s Open Data diplomat Michael Schade (@mvs202) after analyzing our data.
Everyone seems to be using the Wednesday before (March 9) as the comparison to control for day of week and weather those weeks.
The wonderful thing about a population sensor is that it is always sensing. The challenge of a population sensor is to make sense of the sensing.
As you can tell, Placemeter was on the job and showed pretty consistent movement on the trail for the week before and after the metro shutdown:
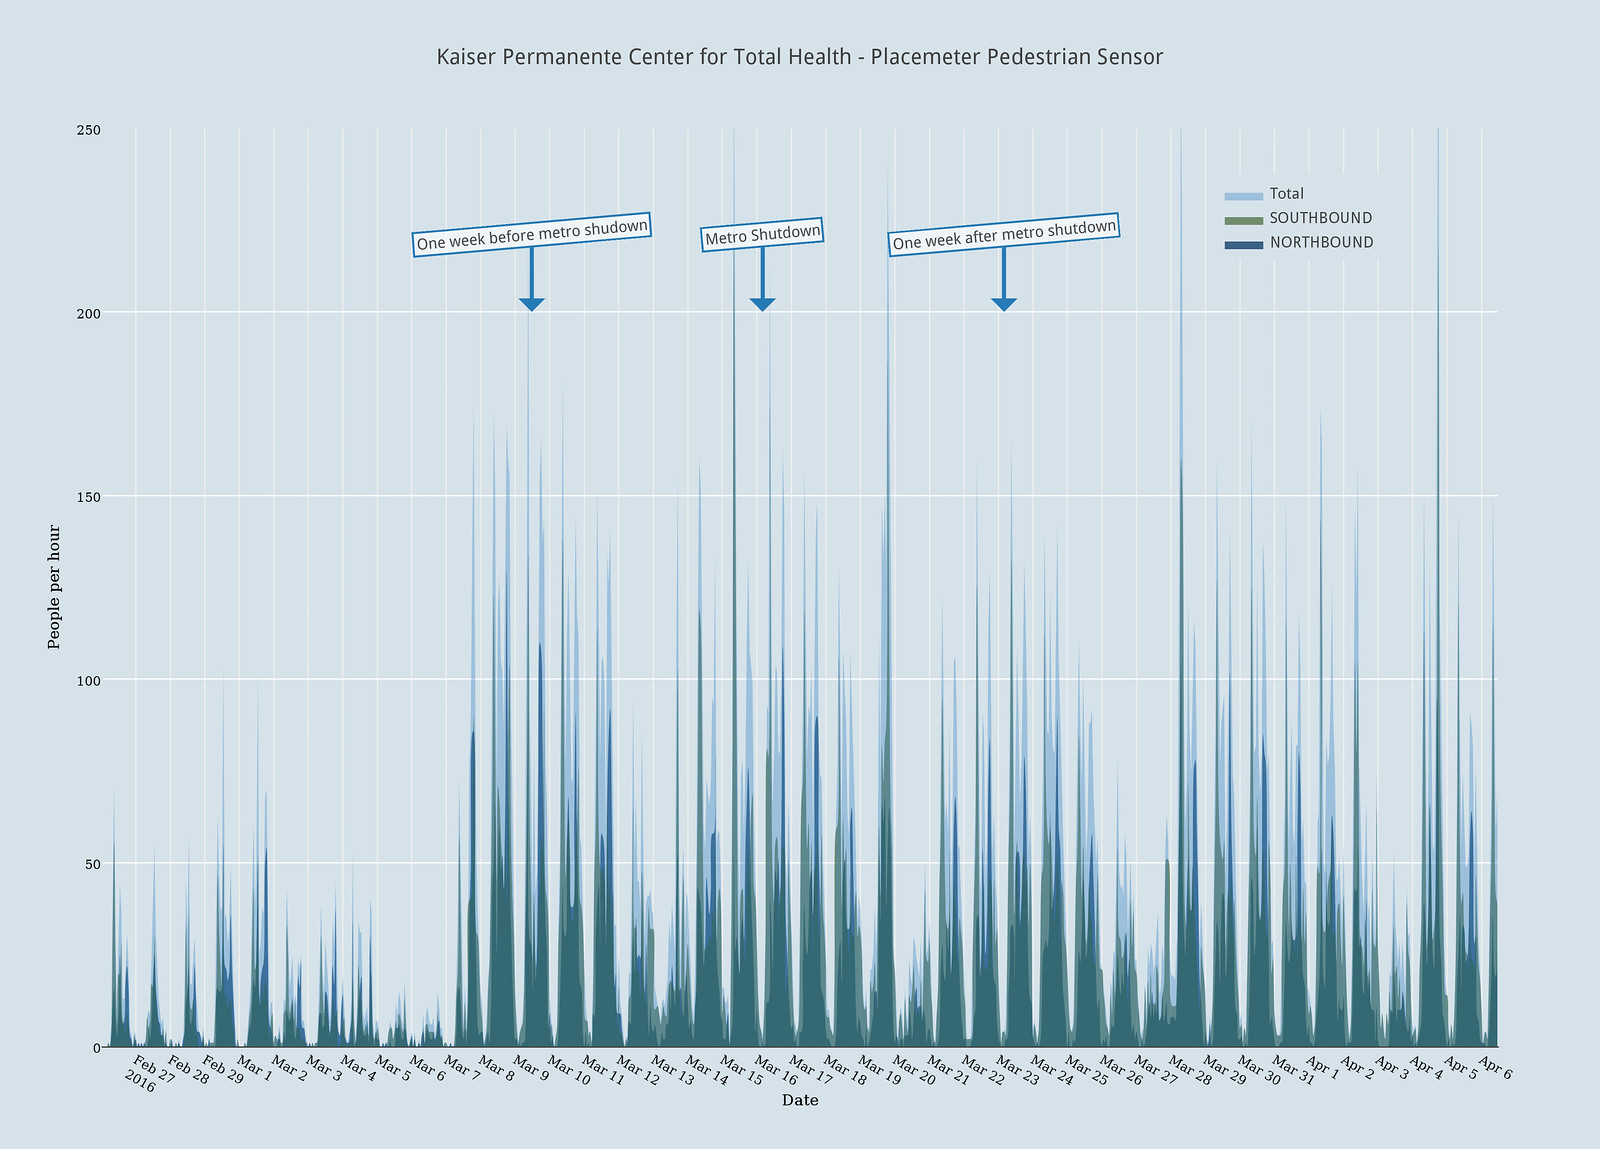
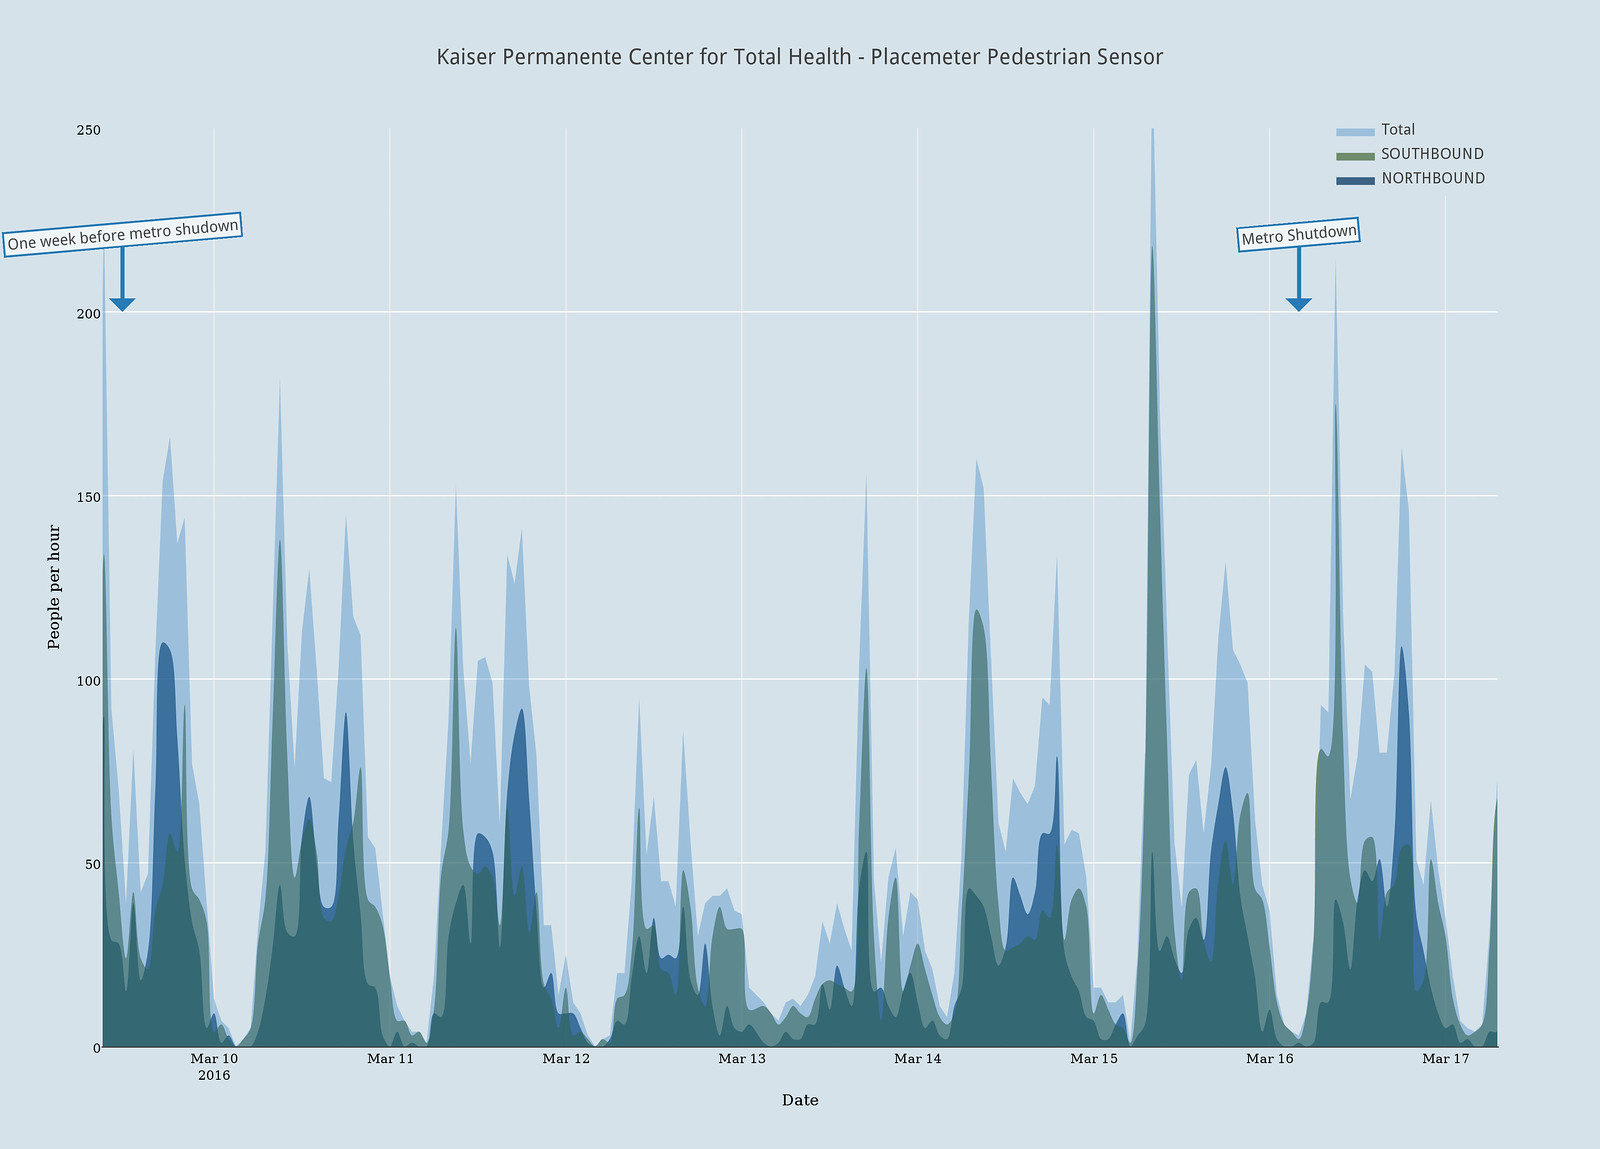
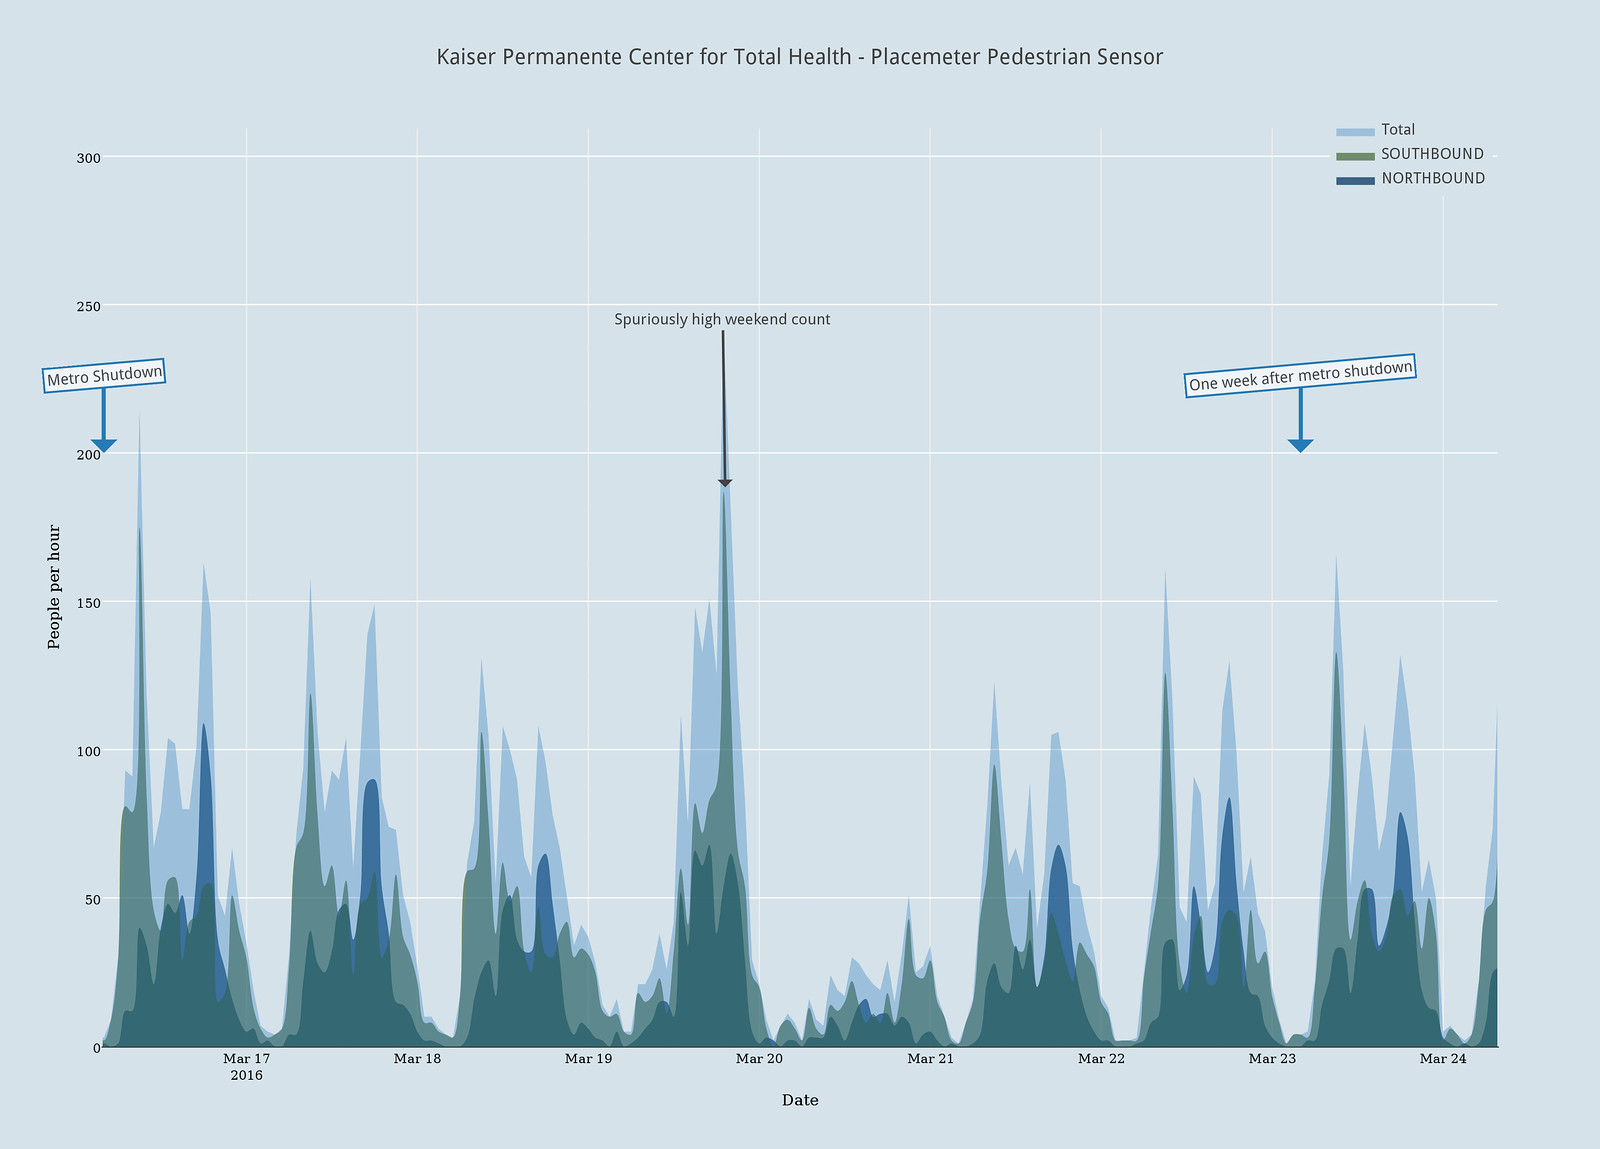
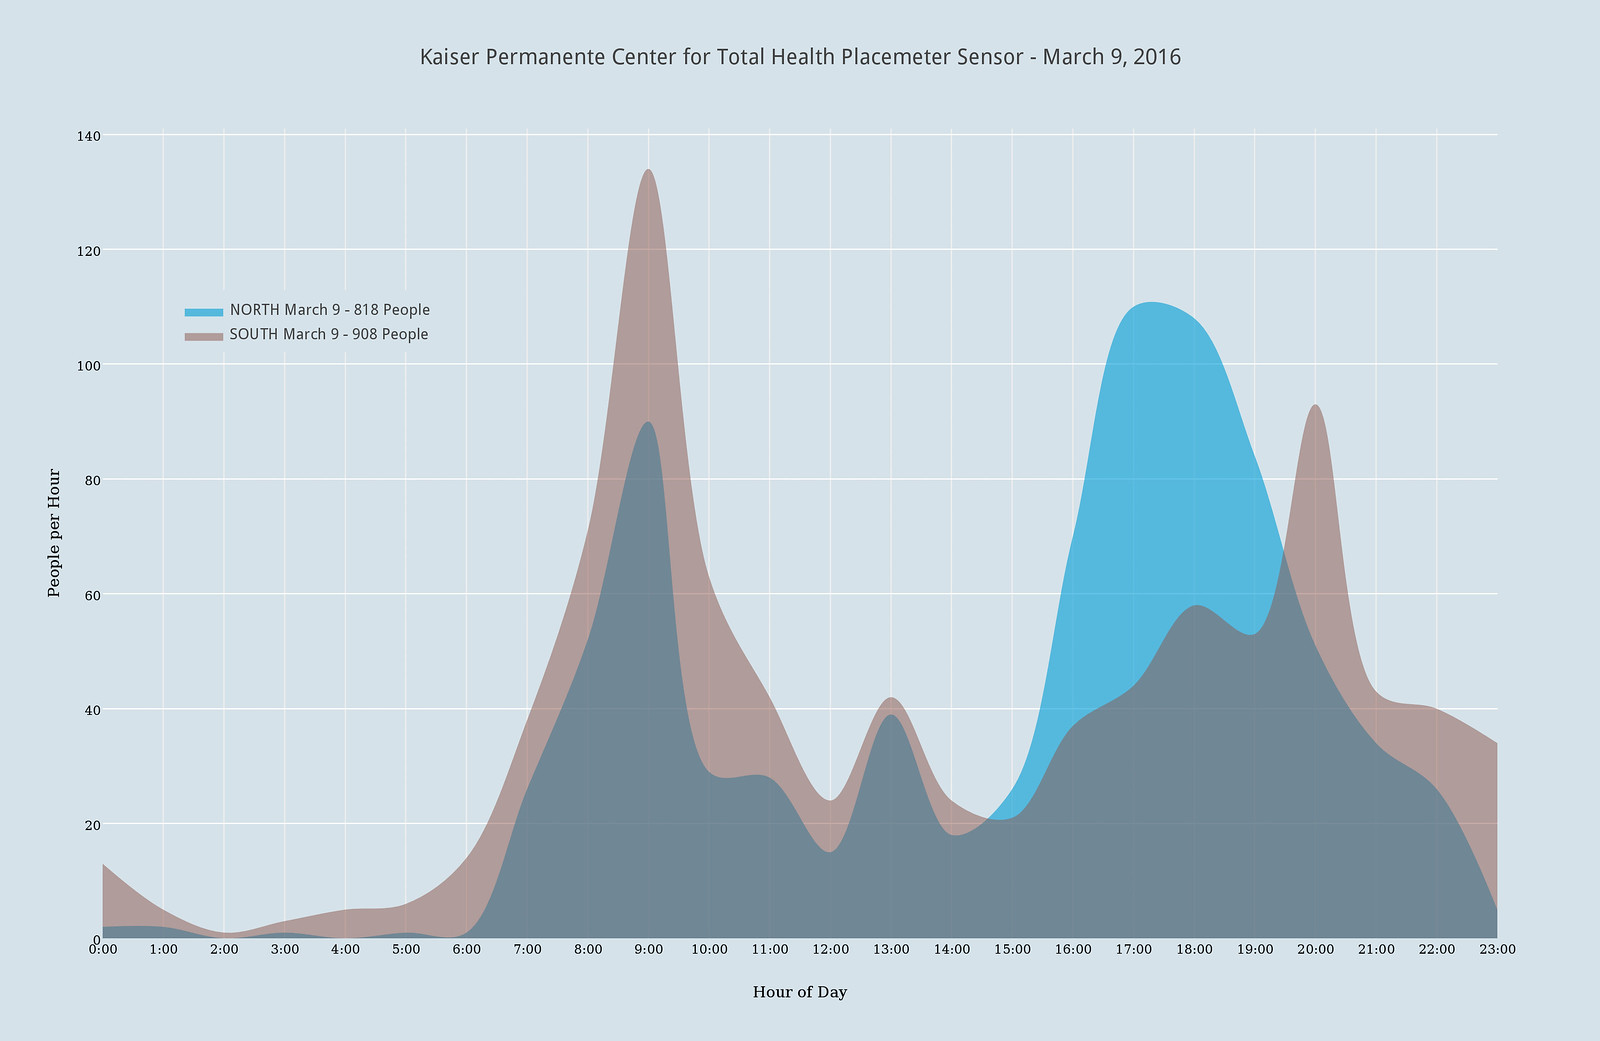
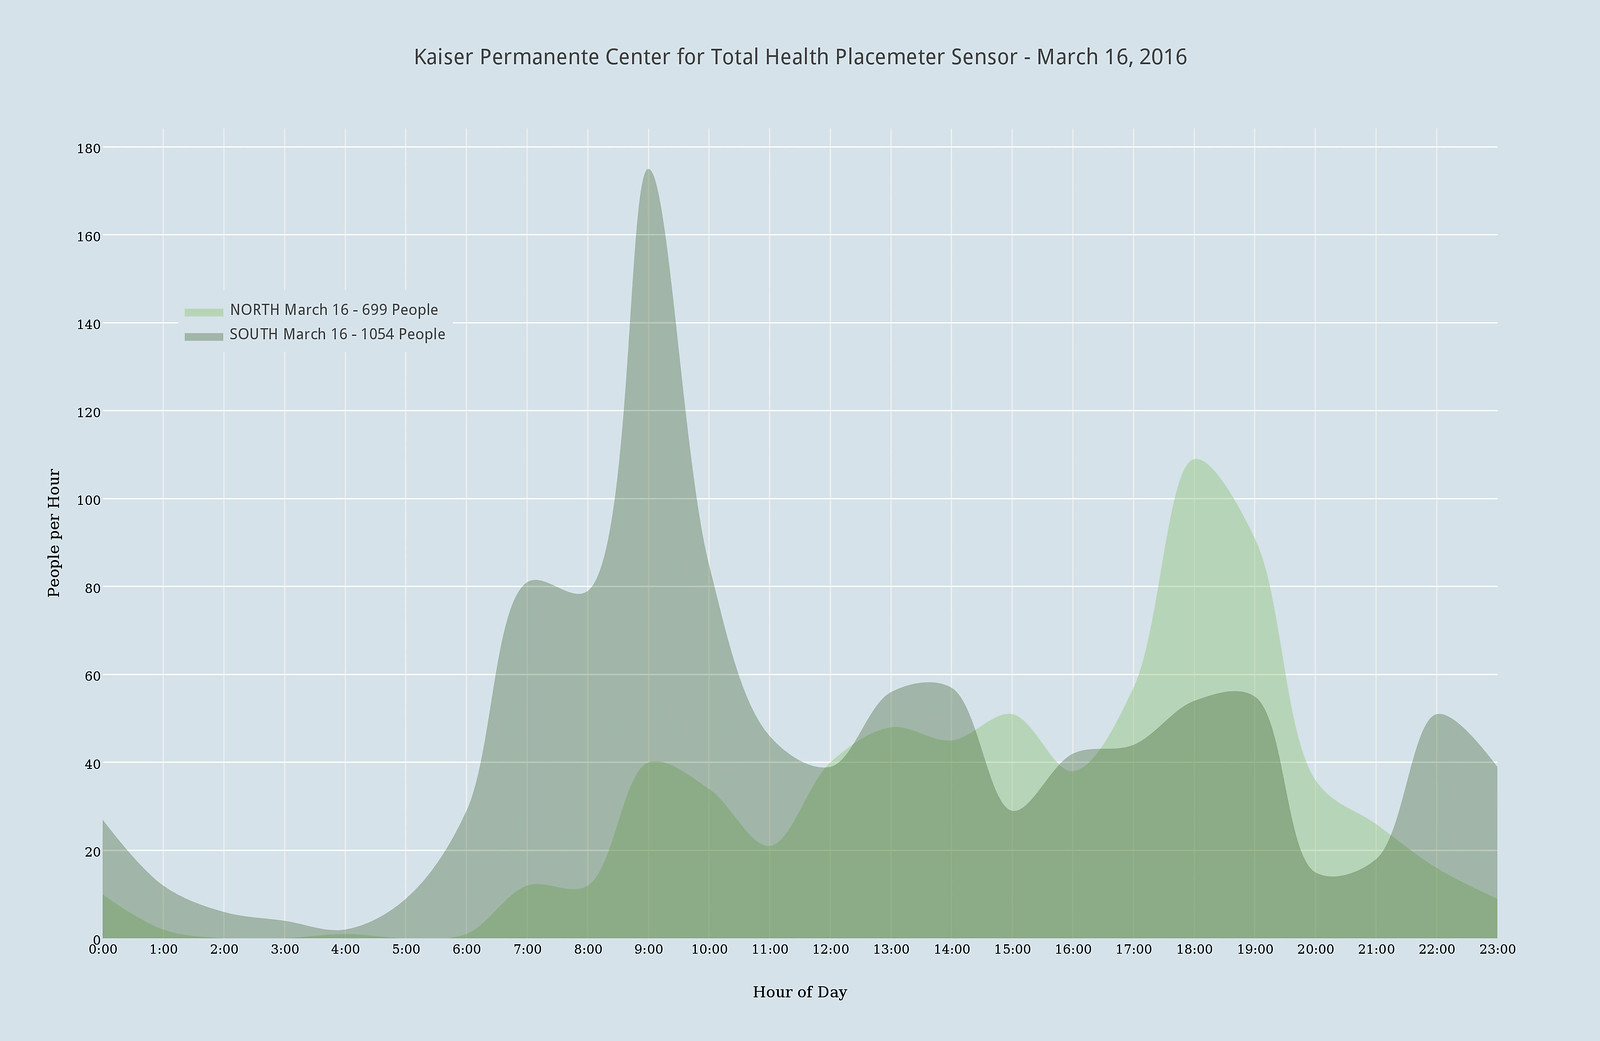
- the same number of people were counted on the trail on March 9 and March 16 (1726 and 1753)
- our data corroborates what Tracy found on an infrared counter located farther north of ours – that this section of Washington, DC didn’t see more people walking compared to other parts of the city
- If you look closely at the pattern of movement on the specific days (March 9 and 16), you could say there’s a more pronounced peak of people going toward downtown in the morning of the 16th compared to the 9th
As Michael pointed out to me, this is an interesting experiment because many things were going on this day:
- Metro was completely shut down
- The Federal Government allowed employees to work from home (telework)
- Capital Bikeshare suspended membership fees
Don’t react, innovate. #activetransportation @bikeshare 👍 https://t.co/eWTrzH2Pof
— Ted Eytan, MD, MS, MPH (@tedeytan) March 15, 2016
Therefore it’s possible that more people used active transportation this day on this trail than most, offset by less people walking on this trail because they were leaving a metro station, offset by the numbers of people teleworking on this day.
In this case, the fact that the movement of people is privacy protected via these sensors makes it hard to draw conclusions. This is fine – privacy protected monitoring is of high value in these situations, we like it that way.
In the future, maybe more controlled experiments might be possible, like making bikeshare free for a day while metro is still running. I think it’s unlikely metro will shutdown so we can test whether people walk more 🙂 .
Why we care about this
Our (or let me say my) hope is that these events prompt people to try something new, namely becoming more physically active in a different part of their lives. If the metro shutdown caused people to explore getting to work or moving around the city on foot or bicycle, it’s likely that a proportion of them will consider these modes again in the future.
I’m pleased that our sensor told us something about how the trail is used and shows us that a trail and a city has a heartbeat, almost like a person.
Michael did some additional analyses of bikeshare use on this day, which I’ll post, and I’ll also post the analysis of the data from our infrared counter, which was also at work on these days (so far, the data is consistent across both counters).
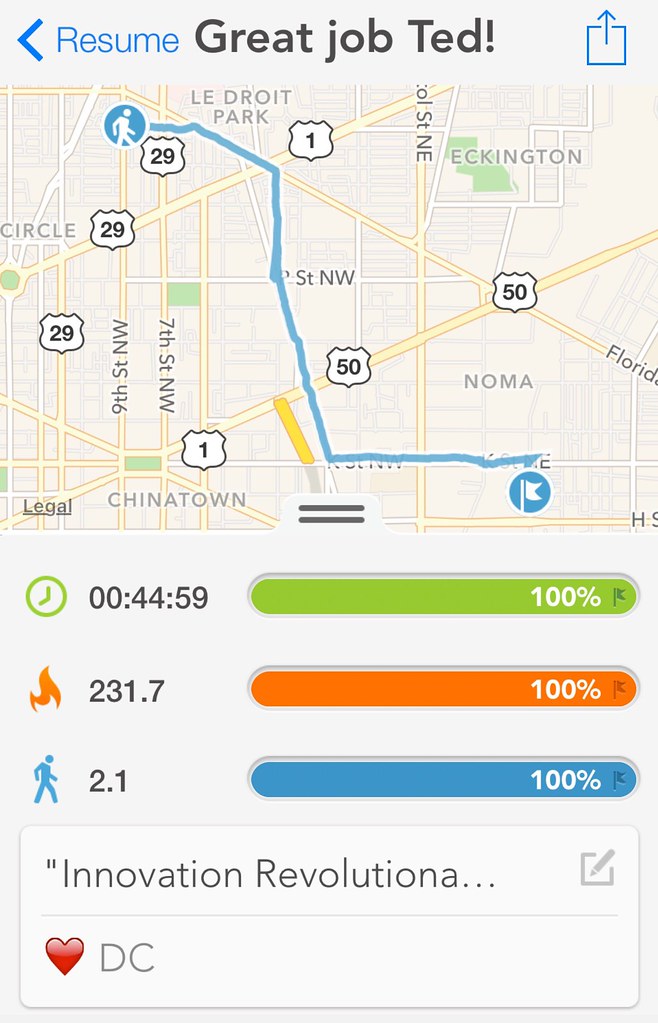
In the meantime, I’ll just do what I normally do, whether metro is operating or not 🙂
6 Comments
RT @tedeytan: Post: Using our @Placemeter video population sensor data to explore the @wmata shutdown https://t.co/fBO4aFd26N cc @BusySparr…
RT @tedeytan: Post: Using our @Placemeter video population sensor data to explore the @wmata shutdown https://t.co/fBO4aFd26N cc @BusySparr…
RT @tedeytan: Post: Using our @Placemeter video population sensor data to explore the @wmata shutdown https://t.co/fBO4aFd26N cc @BusySparr…
Thx for the indepth analysis: Using @Placemeter video population sensor to explore the metro shutdown https://t.co/zb8VVR2bPT via @tedeytan
“Our sensor told us how the trail is used and shows us that a trail and a city has a heartbeat.” @tedeytan https://t.co/vjNJgdwMbE
RT @Placemeter: “Our sensor told us how the trail is used and shows us that a trail and a city has a heartbeat.” @tedeytan https://t.co/vj…