For me this is actually a re-read, since NHANES data is continually being recycled to attempt to describe what’s been happening with American diets.
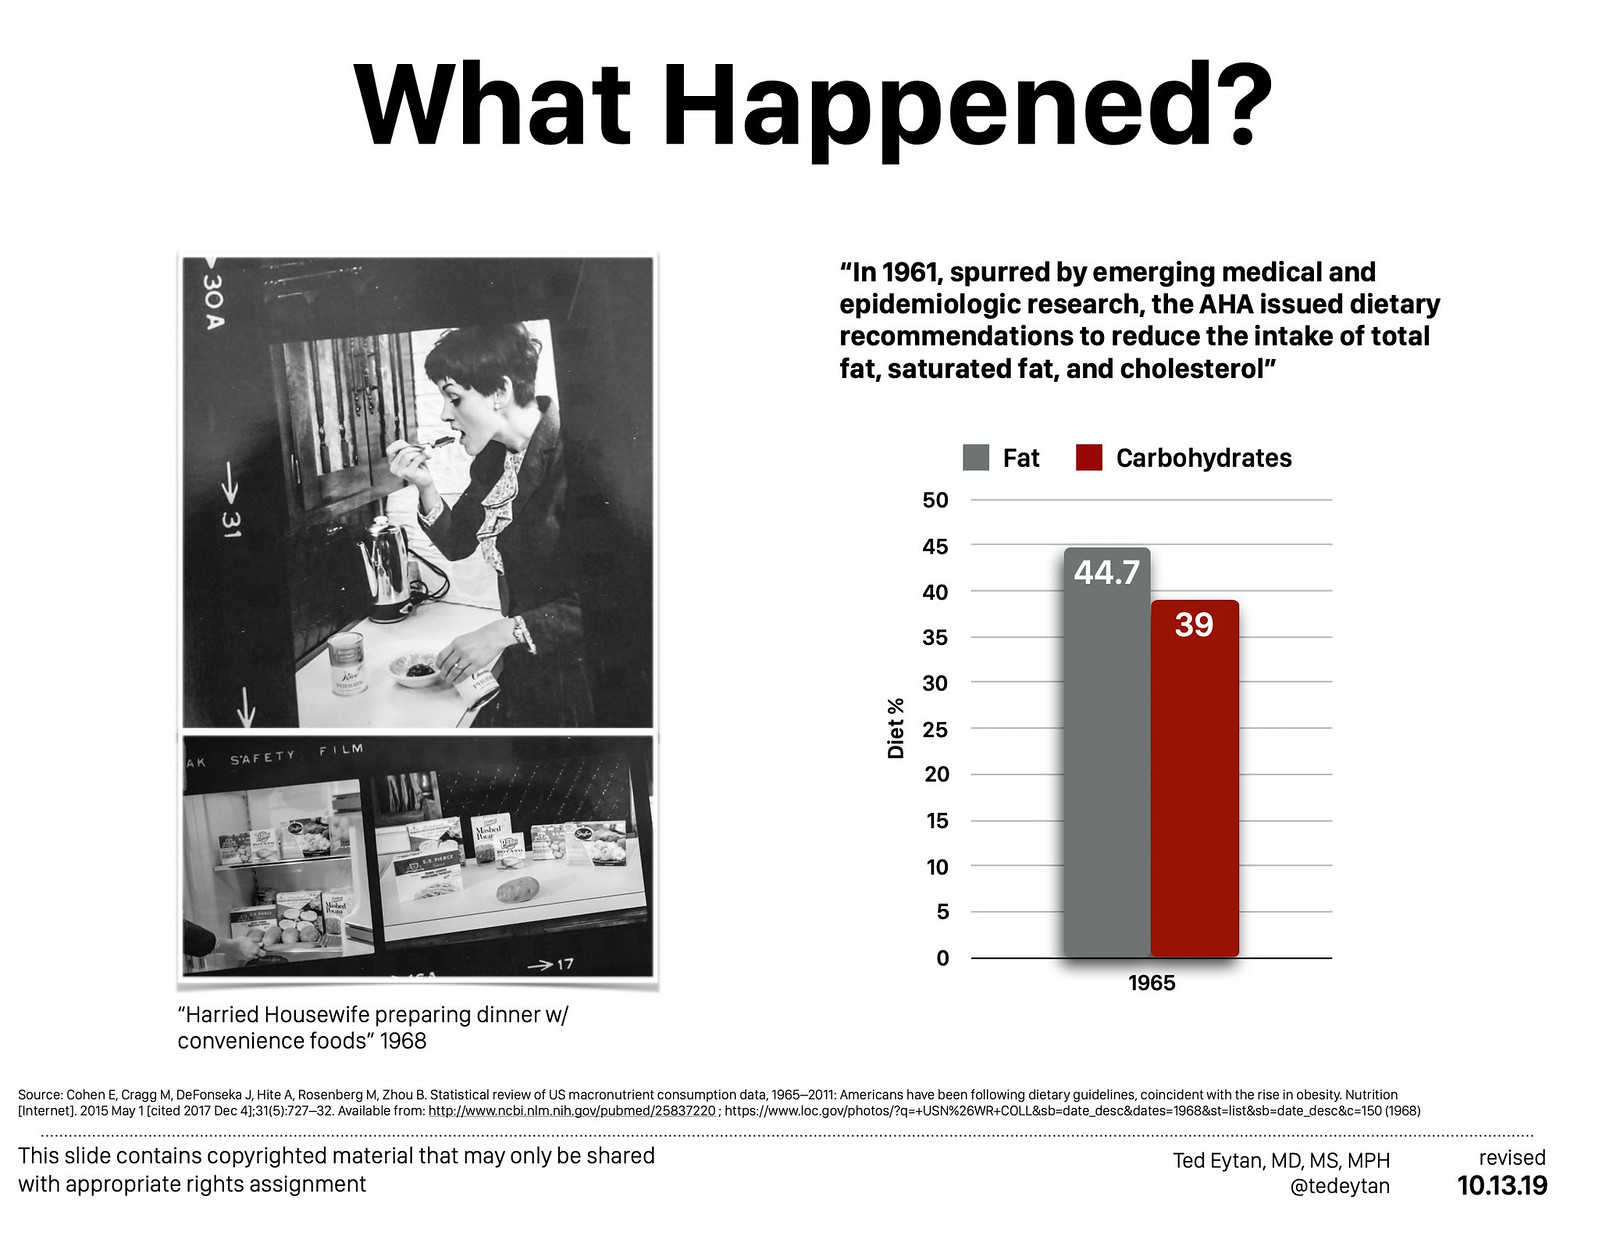
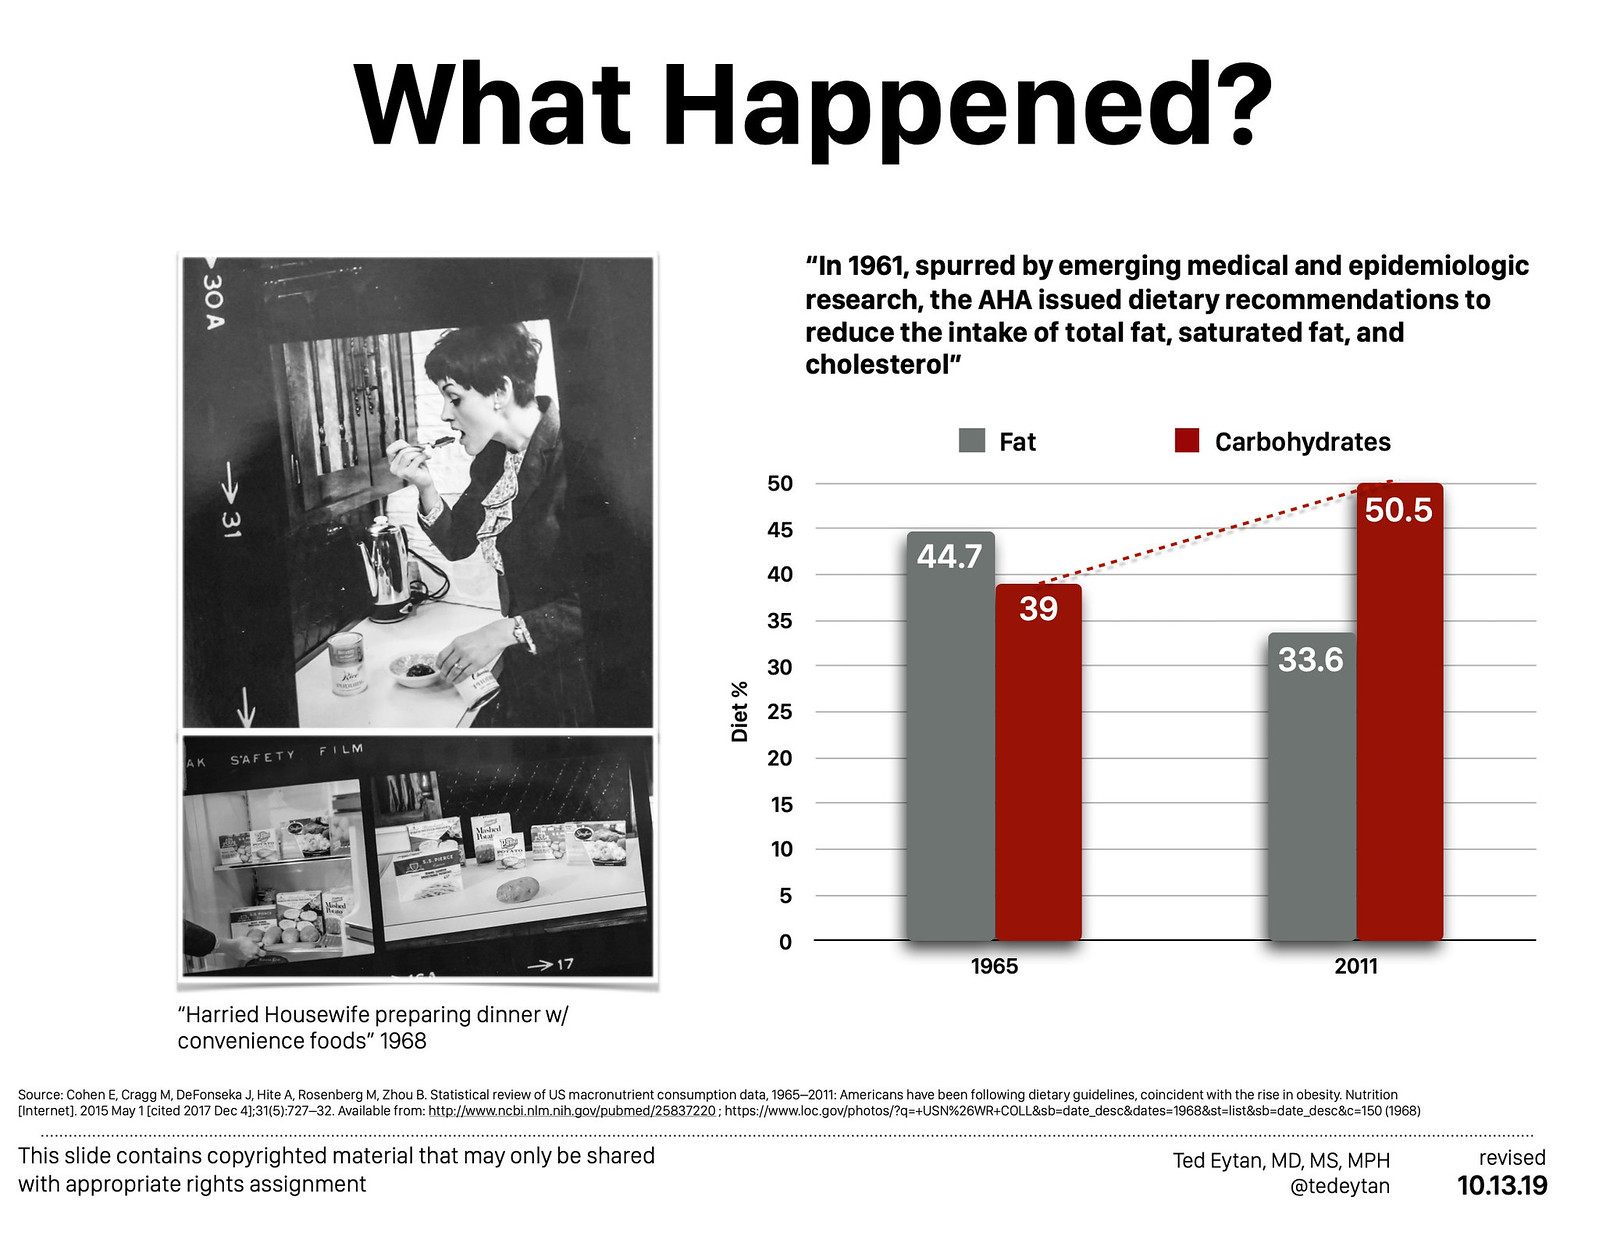
This paper modeled data from 1965 (pre-NHANES, USDA Household Food Consumption Survey used for this year) through to 2011. It describes what is essentially a flip in the American population in the percentage of calories coming from fat vs carbohydrates.

The image in the slides is taken from a trip I took to the Library of Congress photo archives. While searching for something else, I happened on this series, “Harried Housewife preparing dinner w/ convenience foods,” from 1968, which was remarkable to me for many reasons:
- Notice how thin she is. The average BMI of a person in 1965 was 24 kg/m2, below the threshold for overweight (25 kg/m2)
- Look at what she’s photographed making – ultra-processed, high carbohydrate foods. This was not by accident – with the understanding that carbohydrates contain less calories per gram than fats, promotion and production of these products was encouraged, as this USDA report shows (The Many-Splendored Potato, a Marvel of Convenience)

…the shift in the share of fat and carbohydrate is primarily due to an almost 65 g, or about a 260 kcal, daily increase in Americans’ intake of carbohydrate from 1965 to 2011.Cohen E, Cragg M, DeFonseka J, Hite A, Rosenberg M, Zhou B. Statistical review of US macronutrient consumption data, 1965–2011: Americans have been following dietary guidelines, coincident with the rise in obesity. Nutrition [Internet]. 2015 May 1 [cited 2017 Dec 4];31(5):727–32. Available from: http://www.ncbi.nlm.nih.gov/pubmed/25837220
We know what happened next.

“Most people became heavier at about the same time. …We believe it is implausible that each age, sex and ethnic group, with massive differences in life experience and attitudes, had a simultaneous decline in willpower related to healthy nutrition or exercise.” Rodgers A, Woodward A, Swinburn B, Dietz WH. Prevalence trends tell us what did not precipitate the US obesity epidemic. Lancet Public Heal [Internet]. 2018 Mar; Available from: http://linkinghub.elsevier.com/retrieve/pii/S2468266718300215
Correlation is not causation
There is a strong relationship between the increase in carbohydrate share of total intake and obesity. This is reflected by the high correlation at the individual level between caloric share from carbohydrate and adult BMI: 85.3% for men and 91.2% for women.Cohen E, Cragg M, DeFonseka J, Hite A, Rosenberg M, Zhou B. Statistical review of US macronutrient consumption data, 1965–2011: Americans have been following dietary guidelines, coincident with the rise in obesity. Nutrition [Internet]. 2015 May 1 [cited 2017 Dec 4];31(5):727–32. Available from: http://www.ncbi.nlm.nih.gov/pubmed/25837220
Here’s an example of a spurious correlation (there are many more at this site)

Ultimately, it is not known what caused the rise in obesity, even if we can speculate on what didn’t cause it. The physical activity analyses of NHANES are not enlightening on this point either, I will post on that next.
The photos tell the stories
There’s an additional photo which I cannot show here for copyright reasons, called “Well kept refrigerator for the man-about-town” from Look Magazine in 1965. That one shows what one would expect in 1965’s refrigerators – real food, including meat and dairy. If you make it to Washington, DC and can stop in to the Library of Congress, have a look 🙂 .
Here are more photos of the harried housewife and her engineered foodstuffs
References
1. Rodgers A, Woodward A, Swinburn B, Dietz WH. Prevalence trends tell us what did not precipitate the US obesity epidemic. Lancet Public Heal [Internet]. 2018 Mar; Available from: http://linkinghub.elsevier.com/retrieve/pii/S2468266718300215
2. Cohen E, Cragg M, DeFonseka J, Hite A, Rosenberg M, Zhou B. Statistical review of US macronutrient consumption data, 1965–2011: Americans have been following dietary guidelines, coincident with the rise in obesity. Nutrition [Internet]. 2015 May 1 [cited 2017 Dec 4];31(5):727–32. Available from: http://www.ncbi.nlm.nih.gov/pubmed/25837220