This paper is comprehensive and well covered throughout the social media sphere, so just adding a few things in the nutrition realm as well as a point on Washington, DC.
Significant Increases in Fasting Blood Glucose for Americans
High fasting plasma glucose increased in all states; the increase ranged from 127.2% in Mississippi to 1.7% in PennsylvaniaMokdad AH, Ballestros K, Echko M, Glenn S, Olsen HE, Mullany E, et al. The State of US Health, 1990-2016: Burden of Diseases, Injuries, and Risk Factors Among US States. JAMA [Internet]. 2018;319(14):1444–72.
Increase in fasting plasma glucose is across the board, every single state (Table 7):
- 41 % in Washington, DC
- 42.6 % in California
- 105.4 % in New York
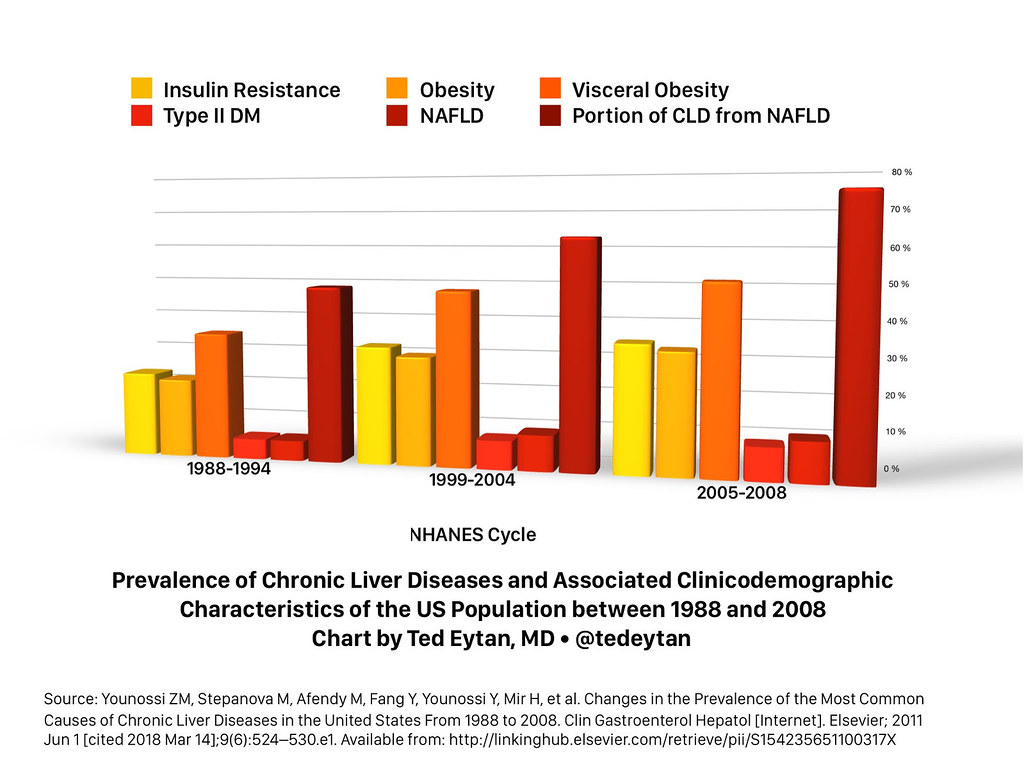
These are bad signs. They indicate increasing insulin resistance, metabolic syndrome, and ultimately (type 2) diabetes and non-alcoholic fatty liver disease (NAFLD) (which most people with diabetes have) which may become the #1 reason for liver transplantation in the United States.
This condition, insulin resistance, and its constellations are only preventable/treatable by diet.
Could Increased Fasting Blood Glucose have been caused by, rather than prevented by, current dietary recommendations?
In the body of the paper, the increase in fasting blood glucose is not connected to current dietary recommendations as a cause.
Current recommendations promote carbohydrate intake and may be partially responsible for this increase.
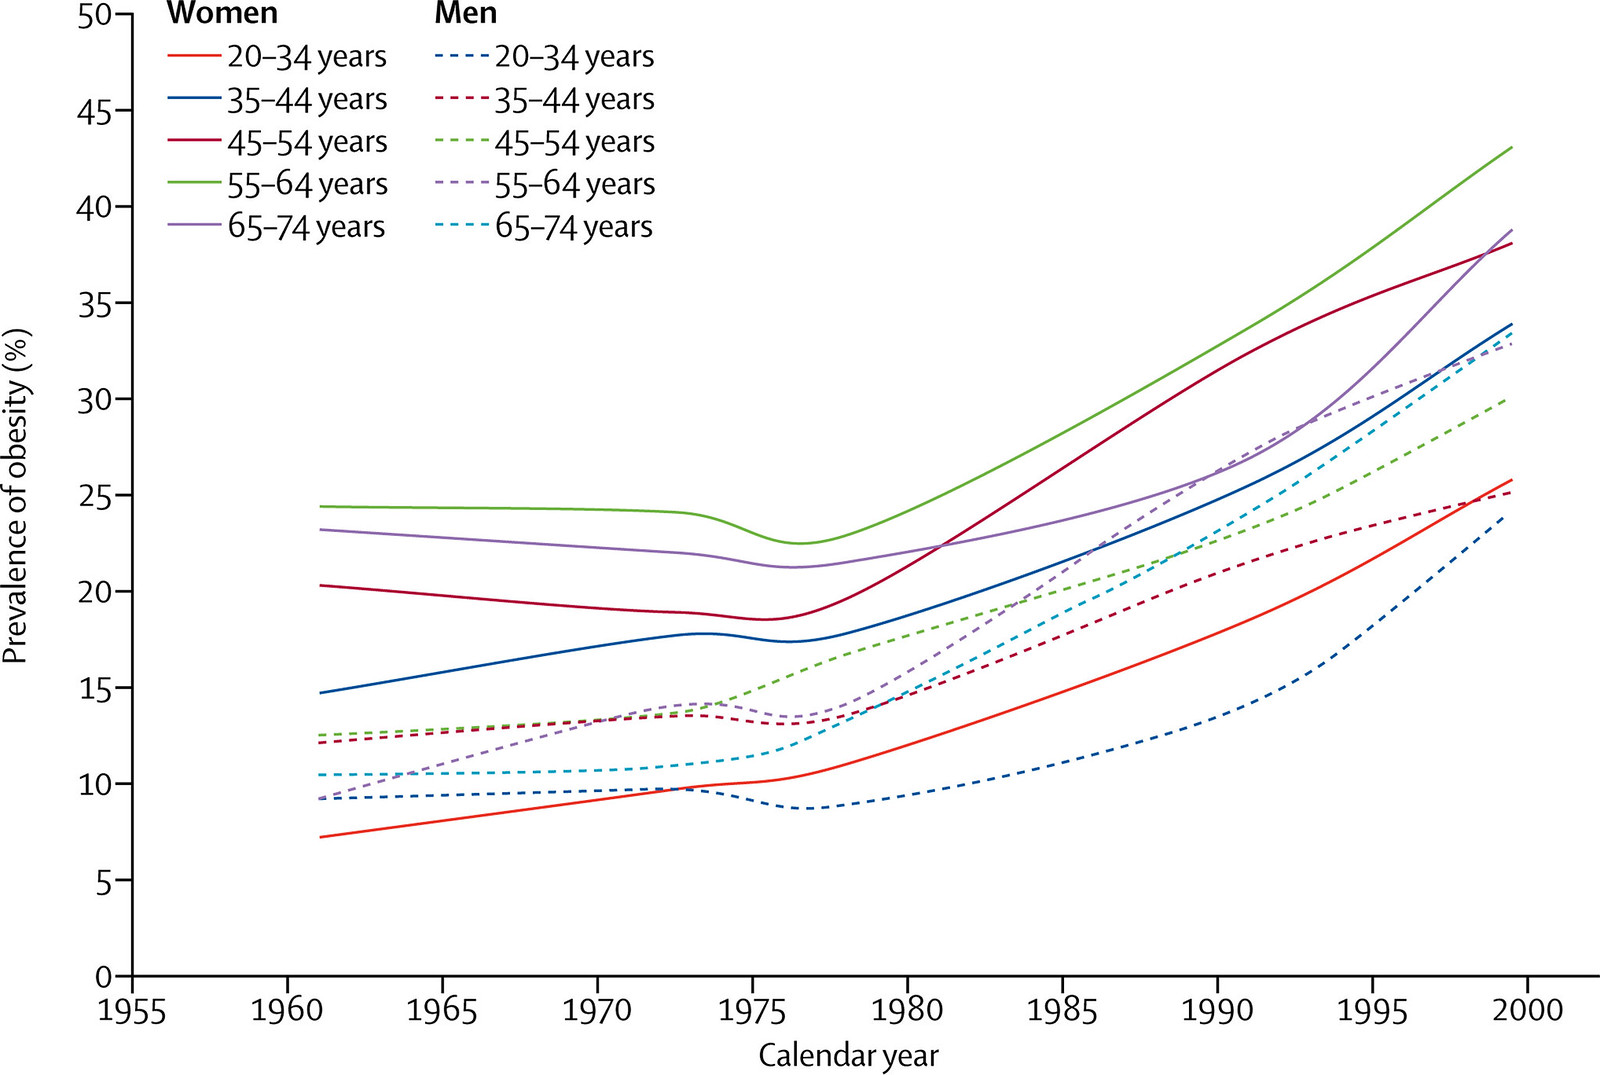
See the paper linked to in this post for more about what’s happened since 1977 (and really, 1961):
The attached editorial says:
Resources such as the 2015-2020 Dietary Guidelines for Americans and the Physical Activity Guidelines for Americans offer evidence-based information to establish healthier eating patterns and to exercise more regularly.Koh HK, Parekh AK. Toward a United States of Health: Implications of Understanding the US Burden of Disease. JAMA [Internet]. American Medical Association; 2018 Apr 10 [cited 2018 Apr 17];319(14):1438. Available from: http://jama.jamanetwork.com/article.aspx?doi=10.1001/jama.2018.0157
Except here’s what happened when those guidelines were put in place:

Diabetes is increased, Non-alcoholic fatty liver disease is unaccounted for
- Diabetes has gone from the #12 to the #8 cause of death and years of life lost in the United States
- The age standardized death rate has gone down (presumably from better treatment), however it has gone down less than other causes of death
- There isn’t a mention of non-alcholic fatty liver disease, even though it is now the overwhelming majority of chronic liver disease in the United States
- Only cirrhosis from hepatatits and alcohol is discussed
All states experienced a considerable reduction in probabilities of death for ages 55 to 90 years, largely associated with reductions in the probability of dying from cardiovascular diseases (Figure 5). The highest point decline was observed in California at 12.6 points, compared with lowest decline of 3.5 points for Mississippi. These declines were somewhat offset by increases in the death rates associated with cirrhosis and other liver diseaseMokdad AH, Ballestros K, Echko M, Glenn S, Olsen HE, Mullany E, et al. The State of US Health, 1990-2016: Burden of Diseases, Injuries, and Risk Factors Among US States. JAMA [Internet]. 2018;319(14):1444–72.
The quote below is confusing, because chronic liver disease from alcohol and hepatitis has been relatively stable or decreasing, while non-alcoholic fatty liver disease is going up, and accounts for the majority of chronic liver disease now.
For cirrhosis, intervention strategies to treat hepatitis C and decrease excessive alcohol consumption are important.

In addition, the connection between high fasting glucose and liver disease is not made in figures 2A and 2B, given the connection between these and NAFLD. For more about the mechanism underlying non-alcoholic liver disease, insulin resistance, and increased fasting glucose: Just Read: Putting insulin resistance into context by dietary reversal of type 2 diabetes
Misunderstanding of Washington, DC as a High sociodemographic index (SDI) future-state
This is repeated in this paper that is in so many others, that don’t look at sub-county level data.
In the United States in 2016, the SDI ranged from 0.874 in Mississippi to 0.978 in Washington, DC (global SDI values in 2016 ranged from 0.268 in Somalia to 0.978 in Washington, DC)Mokdad AH, Ballestros K, Echko M, Glenn S, Olsen HE, Mullany E, et al. The State of US Health, 1990-2016: Burden of Diseases, Injuries, and Risk Factors Among US States. JAMA [Internet]. 2018;319(14):1444–72.
- Looking closely at subcounty data, as one needs to do for Washington, DC, reveals a very different picture, with one of the (or the) highest Gini coefficient in the United States, meaning tremendous inequality within a small region: Income inequality and economic mobility in D.C. – D.C. Policy Center, as well as large health disparities across 8 wards (see: New Maps of DC health data – Not yet one culture of health).
- Therefore, discussing Washington, DC as a place that should only be affected by disease burdens typical of higher SDI places as is done in the article isn’t accurate. Washington, DC resembles both the most advantaged and most disadvantaged in a small area.
- As an example, Washington, DC is reported to have a very high life expectancy (80.2 years) as a whole. However, this breaks down if you stratify by race in our city (Just Read: In DC, there’s up to a 14 year life expectancy gap between blacks and whites that hasn’t changed in 15 years)
- Changes in health are also difficult to intepret the way the authors have done, especially if the comparison is between 1990 and 2016, because of massive changes in demographics since 1990, the population nadir of our city.
These posts help:
- Thanks for publishing my photo, in Goodbye to Chocolate City (Demographic Changes & Segregation Indices) – D.C. Policy Center.
- From District of Columbia’s Office of Revenue Analysis will also help: 2017 marks the third time in 70 years DC has had 694,000 residents | District, Measured
The Data Presented Are Useful Across Many Dimensions
- They tell us about our past, and our potential future
- They encourage us to look outside, in our own community, to see what they really mean
Conflict of interest disclosures
All authors have completed and submitted the ICMJE Form for Disclosure of Potential Conflicts of Interest. Dr Singh reports receipt of grants and personal fees from Savient, Takeda, and Crealta/Horizon; personal fees from Regeneron, Merz, Iroko, Bioiberica, Allergan, UBM LLC, WebMD, and the American College of Rheumatology during the conduct of the study; personal fees from DINORA; and nonfinancial support from Outcomes Measures in Rheumatology outside the submitted work. Dr Degenhardt reports receipt of grants from Mundipharma, Indivior, and Seqirus outside the submitted work. Dr Bell reports receipt of grants from the US Environmental Protection Agency and the National Institutes of Health (NIH) during the conduct of the study, and honorarium and/or travel reimbursement from NIH, the American Journal of Public Health, Columbia University, Washington University, Statistical Methods and Analysis of Environmental Health Data Workshop, North Carolina State University, and Global Research Laboratory and Seoul National University. Dr Mozaffarian reports receipt of personal fees from Acasti Pharma, GOED, DSM, Haas Avocado Board, Nutrition Impact, Pollock Communications, Boston Heart Diagnostics, and Bunge; other for serving on a scientific advisory board from Omada Health and Elysium Health; a grant from NIH and the National Heart, Lung, and Blood Institute; a grant from the Bill and Melinda Gates Foundation; and royalties from UpToDate outside the submitted work.
Thanks to the authors for their work.
Source: Mokdad AH, Ballestros K, Echko M, Glenn S, Olsen HE, Mullany E, et al. The State of US Health, 1990-2016: Burden of Diseases, Injuries, and Risk Factors Among US States. JAMA [Internet]. 2018;319(14):1444–72.
2 Comments
RT @tedeytan: Post: Just Read: The State of US Health, 1990-2016 via @JAMA_current – Noticing Significant Fasting Plasma Glucose Increase,…
RT @tedeytan: Post: Just Read: The State of US Health, 1990-2016 via @JAMA_current – Noticing Significant Fasting Plasma Glucose Increase,…