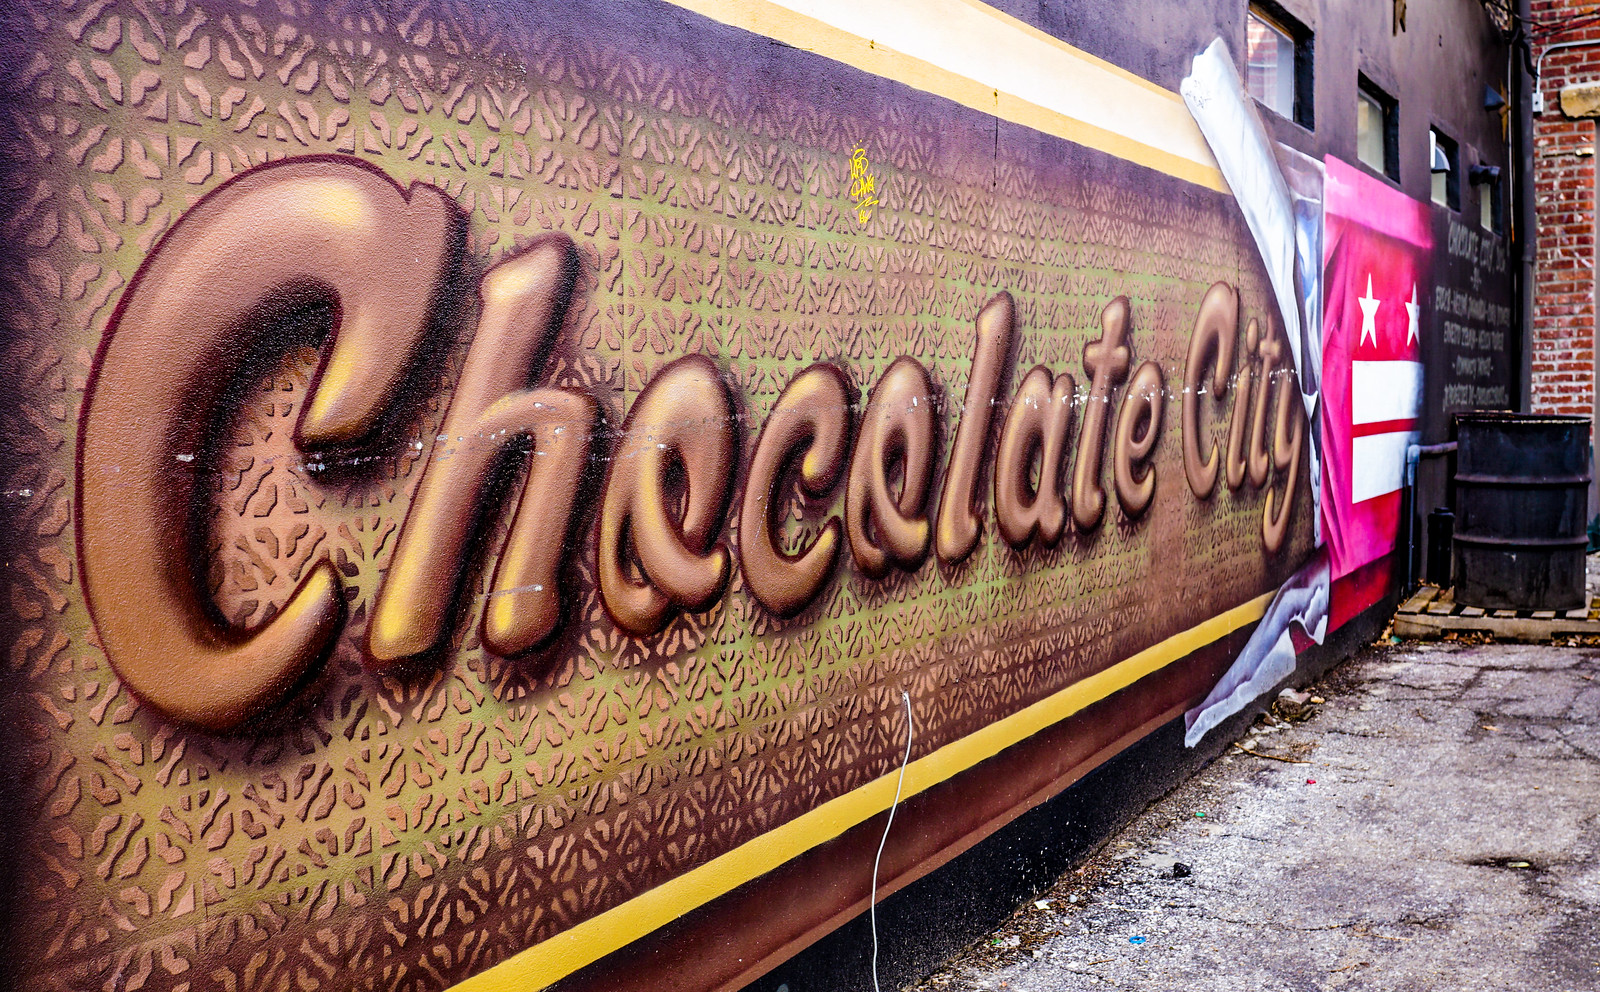
Thanks (again) for publishing one of my photos, DC Policy Center (@DCPolicyCenter). It’s taken in the Logan Circle neighborhood, neighbor to Shaw, which has undergone incredible demographic change (see below). This mural unfortunately faces a narrow alley so it’s difficult to capture its beauty. You can see additional angles here.
This analysis, also excellently performed, informs and corrects an understanding I used to have about Washington, DC’s population. The correct statement:
As of 2015—almost a half century later—D.C. residents identified themselves as 48.0 percent Black, 35.6 percent “Anglo,” 10.2 percent Hispanic (of any race), 3.6 percent Asian, and 2.6 percent mixed race and other.Goodbye to Chocolate City – D.C. Policy Center
There’s a further analysis of segregation in our city and introduction (to me) of the measure “segregation index,” and there has been very limited improvement in this index in 35 years.
The Shaw neighborhood, once slated for destruction by urban planners who thought it “obsolete” has undergone tremendous change:
While the Shaw neighborhood’s population almost doubled, its Anglo population ballooned ten-fold, increasing Anglos from 11.4 percent to 61.7 percent of what had been the old City of Washington’s poorest neighborhood in the 1960s and 1970s.
I continue to enjoy the honor of providing visuals for DC Policy Center’s work. Works are provided under a Creative Commons license, by the way, without compensation, because I love Washington, DC, stories, and stories told with data.
The District of Columbia now joins New Mexico, California and Texas as states without any one racial group forming a majority of the population.