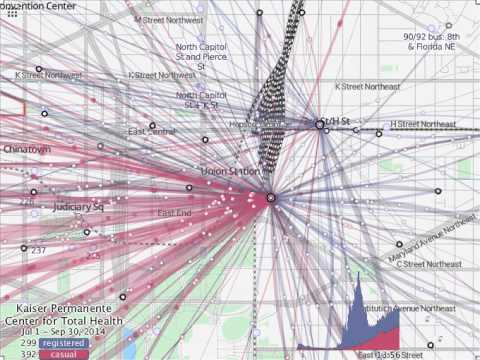
Watch this full screen. You can see the huge influx of people to Washington, DC’s Union Station in the morning, the proportion of people with bikeshare accounts (blue lines) versus “casual riders” who rent on the fly, likely tourists (red lines), who are part of an afternoon outflux. The Center for Total Health (@KPTotalHealth) is in between the two stations visualized.
It’s a cool benefit of technology that supports the sharing of bicycles and provides open data to people who want to understand how people use them, to support basic needs – that’s a version of social innovation.
Visualization is by Michael Schade (@mvs202) who is part of Arlington, VA’s nationally awesome, leading voice of transportation demand management (TDM), Mobility Lab (@MobilityLabTeam):
This is a composite view of the 3rd quarter of 2014, overlaying each day’s CaBi traffic onto a 24-hour view. Only traffic to or from the two stations is shown. The histogram shows the number of cyclists traveling to or from these two stations at each moment.
More facts:
Of Union Station’s 41,190 trips, 16.9% were from casual riders, 83.1%
were from registered riders.Of 3rd & H’s 15,111 trips, 12.9% were from casual riders, 87.1% were
from registered riders.System-wide, 26% were from casual riders, 74% were from registered riders.
Casual riders are those who bought 1- or 3-days passes. We generally
assume they are mostly tourists. Because your stations have lower
percentages of casual riders, I’d assume they are less popular with
tourists.The Lincoln Memorial has the highest percentage of casual riders,
82.3%. Followed by MLK & FDR Memorials (81.2%), followed by Jefferson
Dr & 14th St SW (80.8%), followed by Smithsonian / Jefferson Dr & 12th
St SW (77.3%), followed by Jefferson Memorial (70.4%).
We’ve never really had a view of how people are moving around a city on bicycle before bikeshare (@Bikeshare), and not before people who understand open data and are friends of Total Health could make it viewable like this. And by the way, if you want to understand that our cities are truly changing into low carbon environments, check out these images of 3rd and H Street NE in 2014 and 1947.
Thanks Mobility Lab for helping us understand the tranformation of our city and our little part of it a little better!