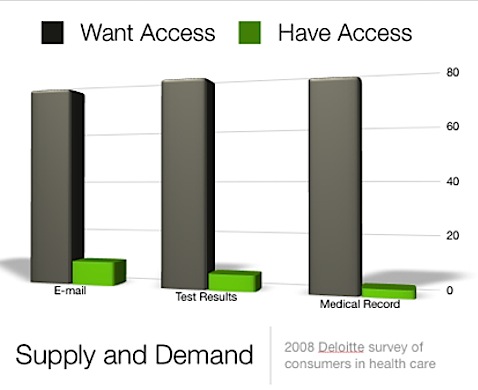
This is the data we have today, can we do better? From the well-done Deloitte 2008 Consumer Survey
Ideas requested….
In the patient-centered technology world, there are a lot of different measures that various organizations use to show the size / accessibility of their online services. The challenge of all these numbers is that when someone tries to figure out who the leader in this space is, or where they are more likely to have access and involvement, it’s unclear. Everyone uses the numbers that capture the data they have (and by extension that are the most optimistic sounding – it’s human nature).
Some measures use number of patients on a provider’s web site (“We have 86,000 patients verified for use of our portal”), some use percent penetration (37 % of adults enrolled or that receive care here are online – that’s the one I used). These numbers can be confused by different denominators (adults only? all enrollees?) and services offered (access to what? claims data? e-mailing doctors? lab results?). One metric we began using at Group Health was, “% lab results reviewed online by patients” – this crosses primary care and specialty care practices, and since the assumption is that most patients want the results of their tests, may be a good measure of how much a provider promotes access to clinical data, other things being equal.
Why is it useful to figure out?
As I mentioned in a previous post, we currently measure penetration of electronic health records in practices (it’s scarily low still); however, this doesn’t say very much about the value to the patient, the customer. So:
- If a patient can compare organization x / provider y in terms of the accessibility of the data – through whatever channel – there may be better incentive to compete on something that matters a lot – involvement in care and partnership.
- If a supporting organization is working to promote patient access across a constituency, they can understand which organizations need more assistance quickly.
Agree? Disagree?
Throw out some ideas for a measure – is it a combination of what is offered (scope of content), how many people are actually using what’s offered (satisfaction with content, priority of the organization in supporting services), and service measures (messages responded to in a timely manner, test results shared)?
Kaiser Permanente provides one example that I am using with permission. As the probable largest personal health record in the world currently, there were 2,140,017 members with access to secure features as of the end of Q1-2008, out of 8.7 million members, and 63.6 % of registered members signed on two or more times in the past 12 months. There are a suite of services on kp.org that include messaging your doctor, access to lab test results, after visit summaries, and a comprehensive health encyclopedia.
This does matter to patients today, like me, as Jen McCabe Gorman pointed out in this post on her blog. She also pointed to a comment on my twitterfeed as well: I am, and I won’t.
1 Comment
Access to online persoanl health data, or patient portal *users* are probably best measured via the usage logs (compared with self-reporting via a survey). We want to know how many different people used the portal (logged on to it) in a given period of time. That's a fairly easy number for the IT dept to get. More complicated is what *percent* of potential users that is. Who do we include in that group of potential users? (the denominator problem you mentioned.) In my organization, we will probably measure log-ons/patient/year, with "patient" yet to be defined. Satisfaction and/or the value perceived from that login will probably be a separate measure that is determined by survey.