In my fielding of this data to various people, this part of the analysis has been by far the most controversial. Let’s first start with indirect costs added on top of direct costs, from the societal perspective, just for California. By indirect costs, we mean lost time from work (absence and short term disability), presenteeism (impairment while at work, to avoid being absent), and caregiving (21 million working men and women are caregivers in the US)

The indirect cost data is only for employed persons reporting the condition, which means it is a subset of the population (doesn’t include indirect costs for the non-employed, doesn’t include costs for the undiagnosed). The graph above is therefore a little bit off, because the medical cost is for all people, productivity costs just for employment related losses.
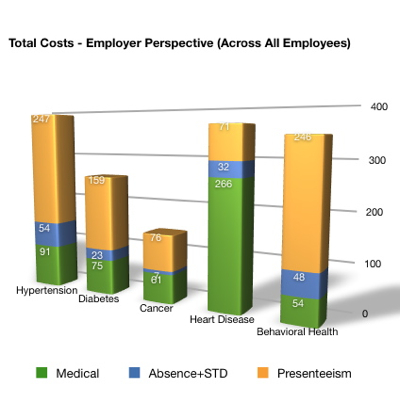
Now, a different look at the data, which averages costs across the entire employee population, from the employer perspective.

This is different because it takes into account prevalence, and spreads that cost over all employees, whether they report the condition or not. My explanation for the different way this data looks is that the medical cost per person for hypertensive employees is far less than for heart disease, but there are many more hypertensive patients in a population. In the employee samples used to derive this data, there’s a factor of 2 difference compared to heart disease (12.4 % vs 6.4 %).
The sources for this data are the same as previous charts (formatted for Zotero, below).
I have already been asked, “Ted, how can high blood pressure cause presenteeism at all?” and I welcome the skepticism. I reviewed the study below, which defined the term for our profession, and it includes a combination of employee studies, some done quite well, that ask about employee impairment and absences due to multiple conditions. This includes things like side effects of medications (which are a cornerstone of hypertension therapy). Questions, based on the study, were things like whether an employee performance was reduced by ‘losing concentration, repeating a job, working more slowly than usual, feeling fatigued, or generally “doing nothing”‘. The authors specifically chose tools that measured multiple conditions at once, so that comparisons could be made.
One novel study worth mentioning specifically is one by Bank One, that used administrative and computerized productivity records of its employees to explicitly measure productivity losses, in addition to using a health risk appraisal and claims data to come up with estimates. For hypertension, the estimate was 0.4 % in this one, which was right in the middle.
Based on my reading of the paper, I am accepting the methodology as supportive. As a student of LEAN, though, I know that the facts are best obtained on the factory floor, so my next interest is in working with an employer, and ultimately and employee, who experiences these conditions first hand. And I do mean on the factory floor, rather than the health system.
After creating this post, I realized that my A3 (coming next) has one inaccuracy. Fixing that, posting it soon.
1. An Unhealthy America: The Economic Burden of Chronic Disease: California. Take a look at the methodology here.
2. Goetzel, Ron Z, Stacey R Long, Ronald J Ozminkowski, Kevin Hawkins, Shaohung Wang, and Wendy Lynch. “Health, absence, disability, and presenteeism cost estimates of certain physical and mental health conditions affecting U.S. employers.” Journal of occupational and environmental medicine / American College of Occupational and Environmental Medicine 46, no. 4 (April 2004): 398-412.
Comment away, this can only improve with input.
1 Comment
[…] for presenteeism and productivity loss does not seem intuitive (I have reviewed this in depth and we can bring in clinical champions to […]